Article:
Goddard, P.B., Yin, J., Griffies, S.M., Zhang, S., 2015. An extreme event of sea-level rise along the Northeast coast of North America in 2009-2010, Nature Communications 6, doi:10.1038/ncomms7346
Background
Coastal sea-level is constantly changing. At the minimum, there is a cyclical rise and fall with the tidal cycle. Additionally, strong coastal storms create storm surge, which can raise local sea level tens of feet over short durations. But unlike a bath tub which fills up uniformly, sea-level can also rise significantly in one location, and remain relatively unchanged in other locations. Like most climate trends, sea-level is full of fluctuations, though the decadal trend is continually rising. Sea-level can vary drastically on both spatial and temporal time scales.
In this study, Goddard et al. investigate an unprecedented rise in sea-level along the Northeastern coast of North America from 2009-2010. The researchers analyzed water level data from tide gauge stations along the east coast of North America. The east coast was divided into three regions: the Northeast (north of New York City), Mid-Atlantic and Southeast (Figure 1). A total of 14 tide gauge stations were used from this Northeast region to examine the rate of sea-level rise.

Results
When looking at the long term sea-level rise, we can see that sea-level may vary year by year, but the overall trend is a rise in the mean height. For the Northeast coast of North America, sea-level rises at a rate of 2.5 mm per year, though the standard deviation is much higher at 14.5 mm per year. This indicates that the annual variability in sea-level greatly exceeds the long term average rate of sea-level rise. In 2009, that sea level rise standard deviation of 14.5 mm was greatly exceeded, with a deviation of 46.9 mm in just one year. By 2010, sea-level rose a total of 100 mm, a hair under 4 inches. This jump in sea-level height was exceedingly unusual, calculated to be a 1-in-850 year event. More incredibly, this unprecedented rise occurred during a period when global sea-level slightly dropped. The Mid-Atlantic also experienced abnormally high sea-level rise between 2009 and 2010, though not as extreme as the Northeast. In parts of the Southeast region, sea-level rise was within one standard deviation, which is within normal annual variability.
Goddard et al. determined that there were two mechanisms driving such an anomalous jump in sea-level: 1. A 30% reduction in Atlantic Meridional Overturning Circulation and 2. An extremely negative period of the North Atlantic Oscillation.
Atlantic Meridional Overturning Circulation (AMOC) is a circulation system where warm salty water from the tropics is transported northward to higher latitudes. This water is cooled and sinks to form deep water masses which flow back towards the south. The Gulf Stream plays a roll in the transport of warm water to cooler northern latitudes. AMOC is just a small part of this global circulation system, and changes in the strength of AMOC have consequences for global climate.
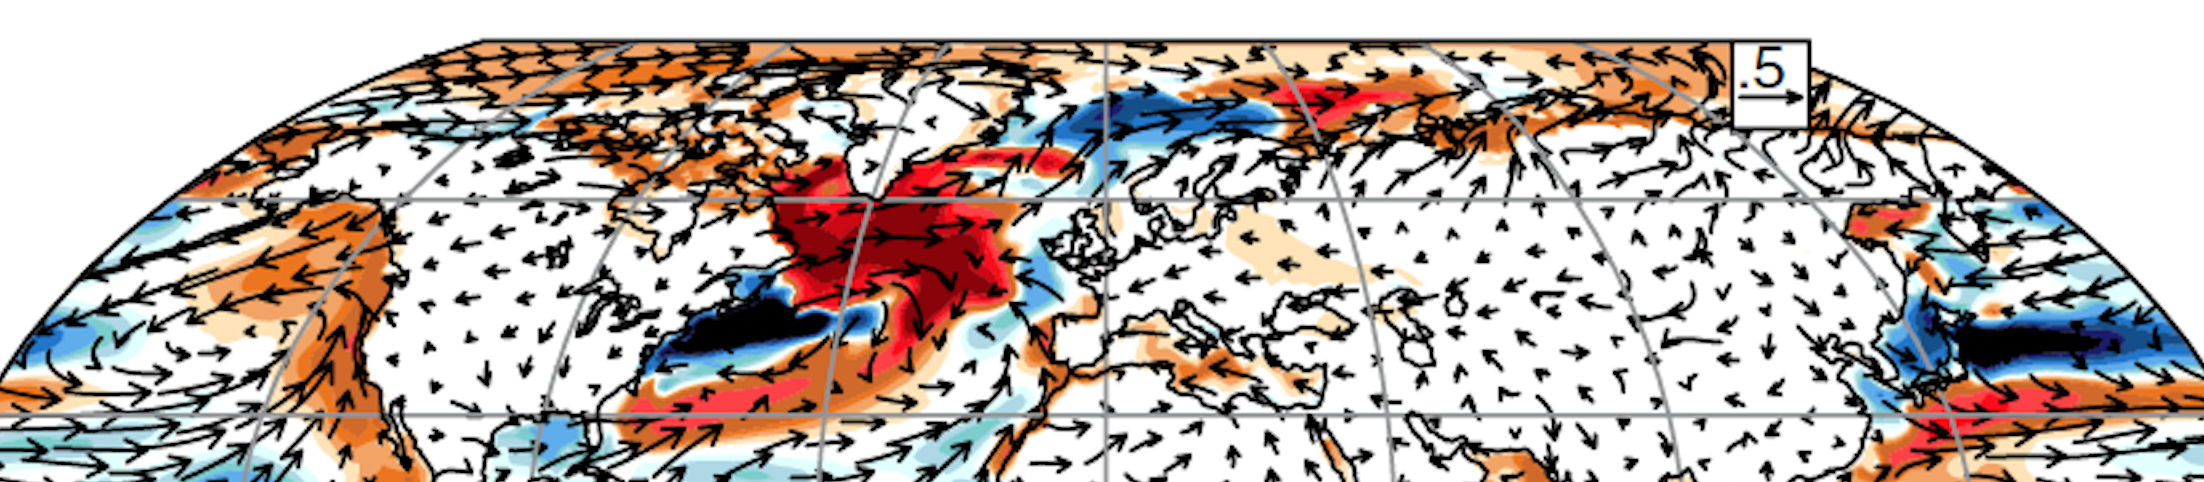
The North Atlantic Oscillation (NAO) is a climate index that compares the strength and position of atmospheric pressure of the persistent low pressure system over Iceland and the persistent high pressure system over the Azores (Figure 2). A positive NAO is characterized by a strong pressure gradient and strong westerly (west to east) winds in the North Atlantic. A negative NAO is characterized by weakening of both the pressure gradient and westerly winds. NAO is a major predictor of seasonal weather in western Europe and the east coast of the United States.

Both the 30% decrease in AMOC and a negative NAO phase are inherently connected (Figure 3) and contribute to sea-level rises along the Northeast coast of North America. More frequent easterly and northeasterly winds can push water towards the Northeast coast causing water to pile up along the coastline, similar to how storm surge causes coastal flooding. A weakening of westerly winds also can affect the distribution of ocean heat transport which has implications for regional climate.

Significance
It is predicted that increased greenhouse gas concentrations will lead to increased frequency of extreme weather events including precipitation, drought, hurricanes and severe winter weather. The authors suggest that extreme sea-level events may also fall into this category of predicted extrema. Climate models support that AMOC will weaken over the next century due to increasing atmospheric concentrations of greenhouse gases. Considering the findings of Northeast sea-level rise and AMOC causality, this weakening of AMOC would likely increase the frequency and severity of extreme sea-level rise events. Coupled with the long-term trend in rising sea-level and increasingly frequent and severe weather events such as hurricanes, human-induced climate change is a serious issue for coastal communities along North America’s east coast.
I am a recent graduate (Dec. 2015) from the University of Rhode Island Graduate School of Oceanography, with a M.S. in Oceanography. My research interests include the use of geophysical mapping techniques in continental shelf, nearshore and coastal environments, paleoceanography, sea-level reconstructions and climate change.

2 thoughts on “A Leap in Sea-level Along the East Coast of North America”