A recent study at the City University of New York (CUNY) has linked urban pollution in the Hudson River to enhanced greenhouse gas (GHG) emissions from the water to the air. Researchers urge for more studies to focus on the source locations of pollution to determine exactly how it is impacting local ecosystems and the ability of the estuary to absorb CO2 – also known as carbon cycling.
A brief history of pollution in the Hudson
The Native Americans of the Hudson Valley – primarily the Mohican and Lenape tribes – once called what is now the Hudson River the Mahicantuck, which loosely translates to “the river that flows two ways.” Long before Europeans arrived in the 1600s and settled along the banks of the Mahicantuck, the Natives had observed that the river ebbed and flowed with the tides, drawing the salty water of the Atlantic into and out of the estuary. This tidal pattern can mix fresh and brackish water together, cultivating a diverse coastal habitat for much of their fish bounty. During that era, oysters, sturgeon, striped bass, and herring were prevalent.
Fast forward to the early 1900s, and the Hudson had changed considerably. Near the flourishing coastal metropolis known as New York City, seas of garbage floated in the water. Fish populations had been suffocated by low oxygen. By 1927, the once booming oyster industry had all but reached its end after pollution had contaminated these filter-feeders. The situation escalated through the mid-20th century as the human population continued to grow, indiscriminately dumping industrial toxic waste and sewage into the once diverse and productive estuary.
Since the Clean Water Act was enacted in 1972, the condition of the Hudson River has vastly improved. While the oyster population remains inedible, oyster restoration efforts are starting to look promising. Still, pollution remains a big problem for the Hudson River Estuary (HRE). Billions of gallons of sewage are deposited at depth every year, and the accumulation of chemicals by factory dumping in the last century is still detectable in the river’s food web and sediments.
Monitoring the river that flows two ways
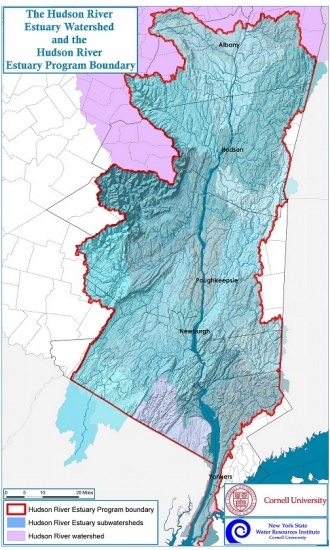
In this study, researchers measured concentrations of greenhouse gases in the surface waters of the HRE at midchannel sites as well as in surrounding tributaries (streams flowing into the larger river) and embayments (coastal indentations) that supply freshwater to the main channel (see Fig. 1).
A total of 31 sites were measured from NYC to Albany in 2013 and 2014, mainly by the riverkeeper patrol boat, R. Ian Fletcher, during its monthly water quality surveys. Surface waters were pumped onboard and a number of sensors were used to record concentrations of carbon (CO2), methane (CH4), nitrogen, oxygen, chlorophyll-a (a pigment emitted by photosynthetic algae), and enterococci (bacteria that serve as a poop indicator in water).
With the help of salinity measurements, the researchers identified the salt concentrations that characterized different regions of the estuary. Water temperatures determined the amount of CO2 that could be stored in the water, and wind speeds informed the calculated rate at which gases were transferred between the air and water.
How polluted is the Hudson today?
Perhaps unsurprisingly, the researchers found elevated levels of CO2 and CH4 in the surface waters near urban tributaries, where inputs of carbon and nitrogen were high compared to the middle of the channel. CH4 concentrations in general were highest in urban areas, especially around NYC. At about 99% of the sites, GHG concentrations in water exceeded those of the overlying air, meaning that water was a source of GHGs to the atmosphere. GHG emissions (i.e., gas transfer from the water to the air) were also influenced by the winds in each region, which typically cause stronger air-sea gas exchange at higher wind speeds.
The variations in CO2 and CH4 levels were largely explained by oxygen, enterococci, and chlorophyll-a levels, especially in salty waters, which indicated that these elevated GHGs were the result of urban wastewater input from about 50 sewage delivery sites in nearby tributaries and embayments. In contrast, GHGs in Albany were explained by different parameters – namely, oxygen saturation, river discharge, and temperature – and exhibited the lowest CO2 concentrations of all of the regions. This result demonstrated that conditions can vary drastically along a single estuary, emphasizing the need to carry out continued studies to understand the role different urban estuaries might play in carbon cycling.
Estuaries: carbon sources, carbon sinks

While many coastal habitats like salt marshes and mangroves are known to capture carbon from the atmosphere, urban estuaries like the HRE usually do the opposite. Such estuaries are abundant in nutrients from sewage and river runoff, allowing bacteria to multiply, emit carbon dioxide, deplete oxygen, and spread toxins. This can make conditions nearly unlivable for other organisms and potentially cause harmful algal blooms. As such, it is vital to monitor the impact of anthropogenic inputs on ecosystems and carbon cycling in similar urban estuaries.
Carbon cycling – which influences climate by regulating the amount of carbon dioxide present in the air – is driven primarily by differences in carbon concentrations between the ocean and atmosphere. The role of coastal regions and estuaries in the global carbon cycle is still unclear, but studies like these are essential to providing the data needed to inform local communities as well as climate scientists.
I’m a PhD student at the University of Rhode Island’s Graduate School of Oceanography. I use a small-scale computer model to study how physical features like surface waves at the air-sea interface produce friction for the wind that can limit momentum, energy, gas, and heat exchange between the ocean and atmosphere. In the future, I hope to learn more about the role waves play in different parts of the world as weather and climate patterns evolve. Also, I love to write.