Undergraduates from all over the US have come to the University of Rhode Island Graduate School of Oceanography this summer to pursue research projects in oceanography as part of the Summer Undergraduate Research Fellowships in Oceanography (SURFO) program. Learn more about what they’ve been up to in the second part of a two-day series of short blog posts they’ve written for oceanbites! (See Part I here)

“Through the looking glass – imaging the microbial ocean” by Hyunyung Boo
“Black Sea Bass: Not so Black and White” by Connor Jones
“Digging up Diatoms” by Kyle C. Rennel
“Improving Hurricane Modeling through Wave Validation” by Joshua Port
“Flooding due to Spring High Waters” by Nicole Statler
Through the looking glass- imaging the microbial ocean
Hyunyung Boo — McGill University

If you’ve ever gone swimming in the ocean and swallowed some seawater, you could easily tell me the taste – salty. You may not know, though, that your salty mouthful came along with thousands of tiny organisms that ended up in your belly. These tiny ”bugs”, called plankton, form the base of the massive ocean food web and also produce that characteristic ocean smell. Their impact on fisheries and climate is so crucial that scientists from all over the world spend their lives studying them in the laboratory, in the field, and even from space using NASA satellites.
These planktonic organisms, which ultimately feed the bright and eye-catching animals of the sea such as dolphins and clownfish, are often just as beautiful in their own right when seen under a microscope [figure1]. However, their small size makes them difficult to study. Traditionally, plankton have been studied by capturing them with a fine net out at sea or by collecting samples of sea water. These samples then are taken back to a lab and studied under a microscope. Until recently, observations of how these microorganisms move and live in their natural environment were out of reach.
The development of new technologies, such as the 4-Deep holographic underwater microscope that I am working with this summer, is allowing researchers to study live plankton in the water column. Rather than the classic microscope, which focuses on a single 2D plane, this instrument is able to record information in a 3D volume over time.


The technology that allows the camera to capture so much information also requires that the images undergo a lot of processing. For example, the following raw image [figure2] can be manipulated to give us this picture of a microscopic chain of diatoms [figure3].

My project this summer is to develop tools to access the wealth of information that this underwater camera collects. By studying images taken of microorganisms in their natural state, we can better understand how these tiny organisms interact with their physical environment and how body shapes relate to ecological roles.
Discoveries in microbiology are closely tied to innovation and new technologies. The invention of the microscope first introduced us to the existence of the microbial world, and advances in microscopy such as the scanning electron microscope (SEM) have allowed us to see microscopic surfaces in incredible detail. This next step in the progression of imaging technologies will hopefully lead us to the observation of microbes in situ in real-time and let us peer into the little known world of the microscopic ocean.
Black Sea Bass: Not so Black and White
Connor Jones — SUNY Binghampton

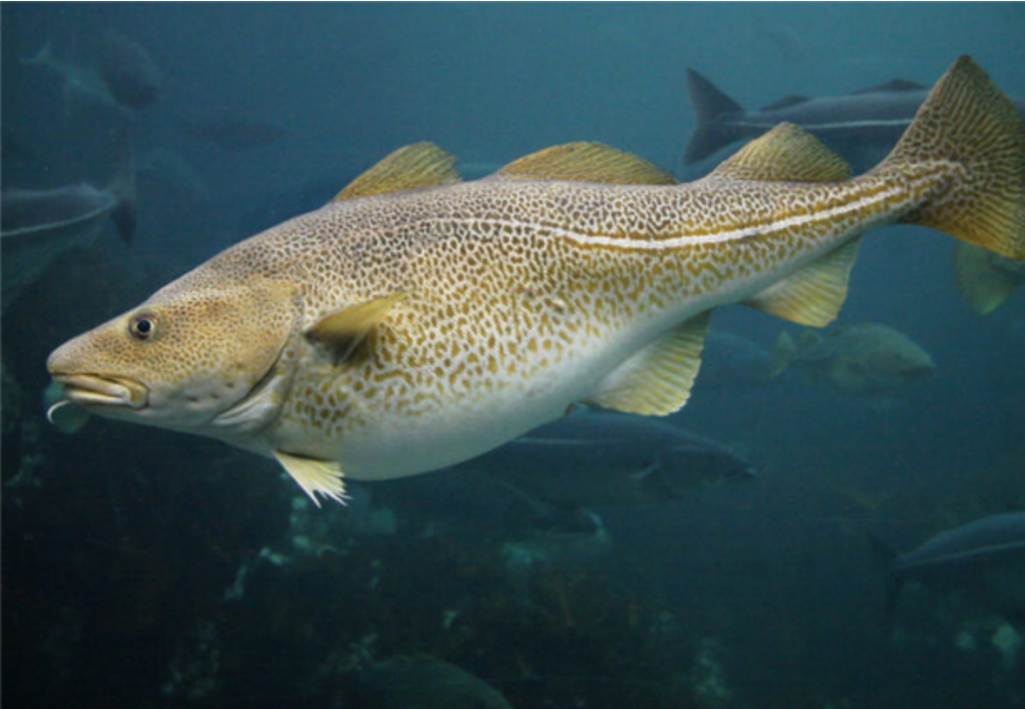
Black sea bass (pictured above) have the ability to change sex from female to male. My research aims to figure out when (size and age) black sea bass make that transition and when they reach maturity. I also hope to discover correlations between a fish’s physical appearance and its sex. This information could be used to determine the sex of a fish without dissecting it to look at its reproductive organs, which is what I currently have to do. The end goal is to gain a better knowledge of the black sea bass population in Narragansett Bay. This will hopefully lead to better informed management decisions so that we can avoid overfishing this species.
Black sea bass belong to the same family as groupers and are not related to other types of bass such as striped or largemouth. They prey on smaller fish, squid and crustaceans and can grow to 60 cm (about 2 feet) in length. Black sea bass are found in the Gulf of Mexico and along the east coast of the United States. They are usually only present in Narragansett Bay from May to October, then they migrate offshore and south during the winter. Fish trawl data shows that they were not frequently caught in Narragansett Bay until 15-20 years ago. The fact that they are more commonly seen might be a result of an increase in ocean water temperatures along the coast. Black sea bass can now thrive at higher latitudes that may have been too cold for them in past years. They are a popular fish, both recreationally and commercially, so it is important to get information on the local population now that they are becoming a more permanent member of the community.
One issue we come across is an uneven mix of the two sexes for all age and size classes. Males tend to dominate the older age classes while females make up the younger ones. Not a lot is known about when or why the sex change occurs in these fish. For the most part, it is easy to tell the difference between a male and a female. Dominant males have blue-green coloration and a hump on their forehead. Females lack the hump and are not as brightly colored. However, not all fish follow these general trends. Just the other day I was dissecting two bass that I thought for sure would be female based on their smaller size, lack of hump and lack of coloration, but they turned out to be males. Then I dissected the largest fish we caught, so sure that it was male, only to find that it contained ovaries. We hope that this study will give us more information on the life history of these fish, especially the population in Narragansett Bay.
Answers to Photos: The smaller one (left) is male and the larger one (right) is female.
Digging up Diatoms
Kyle C. Rennel — Lock Haven University of Pennsylvania
You may ask yourself, “How do humans affect something as large as the ocean?”. This is a valid question and one that scientist investigate every day. The research that I am working on this summer looks at the history of diatom productivity within the Narragansett Bay and compares the changes in productivity to impacts due to human activity. Of particular interest are changes in diatom communities in relation to increases in both water temperature as well as nutrient levels.

When diatoms die, their remains sink to the ocean floor. Their skeletons, which are made up of silica, are covered with sediment and preserved in layers on the ocean bottom. This is similar to how dinosaur bones are preserved within sediment layers and then are able to be dug up after millions of years. For my research, I will be taking sediment core samples that span roughly 300-1000 years, and extracting the opal (silica) from these cores. Once extracted, we can then look at the amount of silica in layers of the core and see how it fluctuates throughout history to see how diatom productivity has changed through time. We can then see if there is a correlation between diatom productivity and environmental factors within the bay. So, you may be asking yourself “why is this important?”.
Diatoms are a type of algae known as phytoplankton and are crucial in maintaining the biodiversity and health of aquatic ecosystems. The species Skeletonema costatum (Figure 1) makes up a large population of the diatom community in Narragansett Bay. They are photosynthetic, so they use the rays from the sun to produce their own energy and hold important roles at the base of the food web. They are essential for maintaining habitats in both fresh and salt water, but an overabundance of diatoms can cause disastrous results. When nutrient levels are within a normal range, diatoms function and promote a healthy environment. When there is an increase in nutrients, especially nitrogen, diatom production ramps up and can creates large algal blooms. In Narragansett Bay, nutrient increases are caused by high levels of nitrogen being deposited into the bay by way of fresh water streams and tributaries (although recent efforts have been made to decrease these levels). The algal blooms associated with these nutrient increases can cause dissolved oxygen levels in the water to decrease which is detrimental to organisms that rely on this oxygen within the water column.

In Narragansett Bay there has been a decrease in diatom communities due to warming water temperatures over the past half century. The role that nutrients play in diatom productivity and the rise in water temperature is important in understanding the health of the bay. By investigating these things, we can learn how humans are impacting their environment, which is essential in predicting the future of our oceans.
Improving Hurricane Modeling Through Wave Validation
Joshua Port — Tufts University
This summer, I am working with Professor Tetsu Hara to model hurricanes. We’re looking at how the interactions at the surface of the ocean affect the development of the storm. What are the impacts of surface currents on the speed the hurricane is moving and the strength of its winds? What effect does the hurricane’s wind speed have on the development of ocean waves? In order to answer these questions, we’re working to test Wavewatch III, a model for predicting storm behavior. I am comparing the model’s wave height predictions for recent hurricanes (e.g. Hurricane Irene in 2011) with wave heights actually observed during the storms. If the model, satellite data, and data collected from planes are all consistent, our confidence in using any of the above to predict storm behavior would increase dramatically. If the data from most sources agree, that would either suggest that the sources that did not agree might not be as reliable, or suggest that the model might need some tweaking. If the numbers are all over the place, we would know that we need to correct for potential sources of error or even look into other sources of data.
 In practice, this comparison involves a lot of time on the computer analyzing large data sets in Matlab. The following plot is a visual representation of some of this analysis. It is comparing wave height during Hurricane Irene as predicted in the Wavewatch III model to actual wave height readings taken from CryoSat-2, a satellite that passed overhead several times during the storm (one pass is shown here). The colors in the plot correspond to the wave height at those coordinates, as can be seen from the axes and the color bar to the right of the figure.
For this kind of work, it’s important to streamline the code as much as possible; even a well-written script could potentially take a long time to run depending on the size of the data set. The time it takes will ultimately be worth it though. The more accurate the hurricane model, the better we’ll be able to predict things such as storm surge, wind strength, and wave height before the storm hits land. Being able to better predict hurricane behavior could save money and lives down the road and, given that these storms are getting stronger as the ocean warms, this work is becoming more vital every day.
Flooding due to Spring High Waters
Nicole Statler — University of Portland
This summer my research project is creating two tools that calculate the mean high water spring datum (MHWS) for the National Park Service (NPS). A tidal datum is the elevation of a certain phase of the tidal cycle averaged over 19 years. During those 19 years there are numerous factors that influence the heights of the tides, including the positions of the moon, Sun, and Earth. When the moon and Sun are aligned, this results in what is known as a spring tide. During this period, we see a full moon or new moon and the shore experiences the greatest tidal range caused by astronomical forces, meaning a higher high tide and lower low tide. Having 19 years of data at every location where we want to determine tidal datums is not realistic; sometimes only three months of data is available. My tools are designed to compute MHWS on short-term data with minimal error.

The heights of the tides control many factors involved with a shoreline such as where plants grow, the organisms living there, and flooding risks. With sea level rise and storm surges, knowing the average levels of the tides is necessary for coastal adaptation. A past project by URI’s Environmental Data Center focused on nine northeast coastal national parks, now termed sentinel sites, and determined the inundation risk associated with the mean high water datum for each site under varying sea-level-rise and storm-surge scenarios.
Even though spring tides occur roughly once every two weeks, it is just as important to know MHWS as it is to know mean high water because flooding could be a problem with spring tides while it may not be an issue during other times. Using my tools I will calculate MHWS for three locations at Assateague Island, which is a sentinel site. Using data from the project by URI’s Environmental Data Center, I will determine if any new flooding risk appears when the varying scenarios occur during spring high tides. Since spring tides produce higher high tides, storms and sea level rise occurring at that time could have a more significant impact on coastal areas. So shouldn’t we prepare ourselves the best we can by knowing all the risks associated with the tides and not just focus on one datum?
Not only do coastal city adaptation planners need to be aware of spring tide risks, so do those protecting and working with ecosystems along the coast such as salt marshes. Where the tides reside controls what type of vegetation and life can be found at the marsh. If the marsh is lower in the tidal range there is more flooding and plants do not do as well, however, if the marsh is higher, there is less flooding and plants thrive. Where the marsh sits in the spring tidal range will influence how much flooding the marsh receives during spring tides and potentially affect the vegetation. By finding MHWS, those working to protect salt marshes will know the areas that are most at risk for flooding. In order to help save the salt marshes and other ecosystems along the coastline, we need to know the flooding risks associated with spring high tides have.
I am the founder of oceanbites, and a postdoctoral fellow in the Higgins Lab at Colorado School of Mines, where I study poly- and perfluorinated chemicals. I got my Ph.D. in the Lohmann Lab at the University of Rhode Island Graduate School of Oceanography, where my research focused on how toxic chemicals like flame retardants end up in our lakes and oceans. Before graduate school, I earned a B.Sc. in chemistry from MIT and spent two years in environmental consulting. When I’m not doing chemistry in the lab, I’m doing chemistry at home (brewing beer).