Each summer, the University of Rhode Island Graduate School of Oceanography (GSO) hosts undergraduate students from all over the country to participate in oceanographic research. These Summer Undergraduate Research Fellows (SURFOs) have not only been working with GSO scientists, but they also have spent part of their time learning how to communicate this science to the public. Although their research experience was virtual this summer, they still did a fantastic job. Read on to find out what they have been up to, and why they everyone should be as excited as they are about their work.
Jade Case is currently a rising senior at Rollins College in Winter Park, Florida, majoring in physics. This summer she worked remotely with Robert Pockalny through the Summer Undergraduate Research Fellowships in Oceanography (SURFO) program at the University of Rhode Island to explore the hydrographic patterns in the Pettaquamscutt River Estuary. Although the experience was much different from the hands-on research experience she is used to, she learned a lot this summer and is grateful for the opportunity to do what she loves and continue researching during these unprecedented times. After her senior year she hopes to continue her education study ocean engineering in graduate school.
What’s so special about the Pettaquamscuat River Estuary?
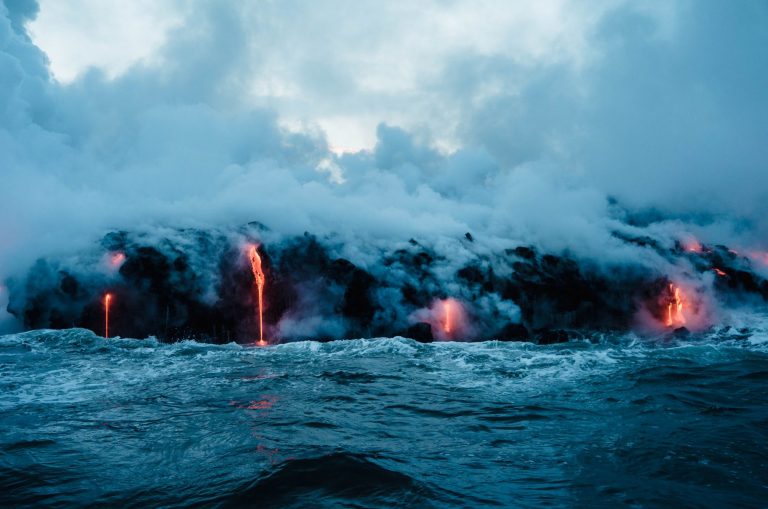
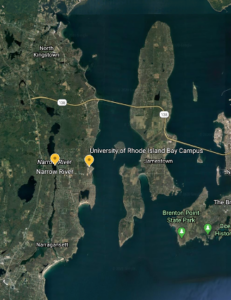
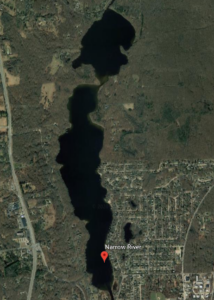
The Pettaquamscutt River Estuary is located in Narragansett, Rhode Island, about 1.3 miles from the University of Rhode Island’s Graduate School of Oceanography. The body of water is a glacial kettle pond which formed as a result of retreating glaciers leaving behind ice, which is then buried in sediment and melts to form a kettle pond. Most kettle ponds are less than 10 meters deep, however, the narrow river has several areas where the depth exceeds 18 meters, giving it extremely unique characteristics.
In addition to having some really deep regions, the Pettaquamscutt River Estuary receives salty and cold water from the Rhode Island Sound, as well as fresh, warmer water from the Gilbert Stuart Stream. This intermingling of very different water sources with different temperatures and salt levels causes the river to become layered. The cold, denser water from the ocean sinks to the bottom of the river, where it creates a layer of water lacking in oxygen.
If we want to understand the workings of the Pettaquamscutt River Estuary, we first have to know how water mixes and circulates throughout the river. Understanding river circulation is important because mixing can change where nutrients are in the river, which can have various effects on the organisms that live in the estuary and the food web.
Why are we interested in the circulation patterns of the river?
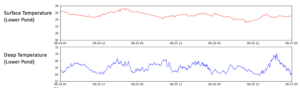
After analyzing data from previous research conducted at the University of Rhode Island’s Graduate School of Oceanography in 2017, we discovered that there was an observable difference between the temperature changes at the surface of the water and the deeper depths of the estuary.
The data collected by the surface probes indicated that the temperature within the first few meters of water has a period of approximately 24 hours. This means that it takes approximately 24 hours to complete one temperature cycle, which possibly coincides with the daily temperature changes in the surrounding environment.
In comparison, the data collected by probes placed at deeper depths indicated that the temperature within this deeper region has a period of approximately 12 hours. These results are shown in the figure below. From these results we asked, “why do we see this major difference between the cycles of the surface level temperature and deeper temperatures?”
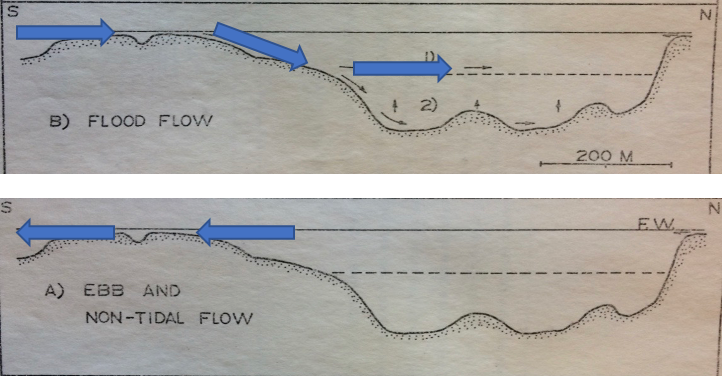
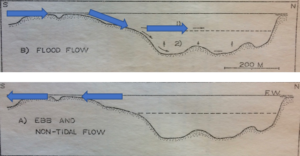
With this question in mind we decided to consider previous studies of the upper pond. Gaines PhD dissertation (1975) performed a similar study on the upper pond of the narrow river. Gaines concluded that the body of water experiences a fjord-like circulation in which the saltwater enters the pond through a shallow sill, or seafloor, flows through the middle region of pond, and then exits through the same sill, as shown in the figure below.
In addition to this similar study which observed the circulation of the upper pond, it is also well known that the gravitational effects of the moon on tides and environmental factors can have an impact on the circulation of a body of water.
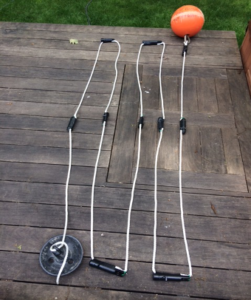
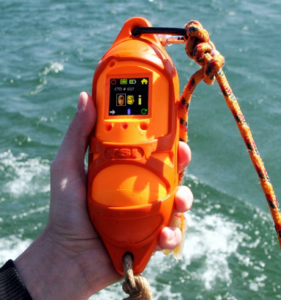
To observe changes in temperature, salinity, and pressure over time, we combined temperature and salinity data from CTD casts (image shown below) along the length of the two ponds with similar measurements from a month-long sensor mooring located in the lower pond. The CTD casts measured spatial variation while the mooring recorded temporal changes in the estuary.
Big Aha’s
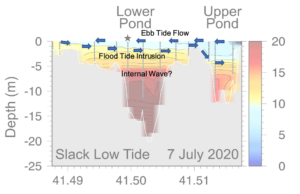
After the month-long collection of data and analysis of the CTD and mooring measurements, we have discovered that the estuary can be separated into three different layers. The surface layer is uniform and composed of fresh warm water with a temperature and salinity cycle that has a strong 24-hour period. The intermediate layer at approximately 2 to 6 meters below the surface has strong temporal variability and a dominant 12-hour period that coincides with the tidal cycle. Lastly, the deep layer at depths deeper than 6 meters is composed of salty cold water, and very few changes in temperature and salinity occur.
Between the first and second layer (light blue and yellow region) is where we see the first region of temporal variability, indicating that we begin to see the intrusion of seawater at this depth. Additionally, we see regions of temporal variability around the region between the second and third layer (between the yellow and red regions). This variability deeper in the estuary may be evidence of an internal wave. However, we currently do not have enough data to conclude that an internal wave is in fact causing this variability. Therefore, further research is needed to determine if the variability in the lower regions of the estuary is attributable to an internal wave.
Kate received her Ph.D. in Aquatic Ecology from the University of Notre Dame and she holds a Masters in Environmental Science & Biology from SUNY Brockport. She currently teaches at a small college in Indiana and is starting out her neophyte research career in aquatic community monitoring. Outside of lab and fieldwork, she enjoys running and kickboxing.