Citation: Zhang, J., Weijer, W., Steele, M., Cheng, W., Verma, T., & Veneziani, M. (2021). Labrador Sea freshening linked to Beaufort Gyre freshwater release. Nature Communications, 12(1229). https://doi.org/10.1038/s41467-021-21470-3
[hr]
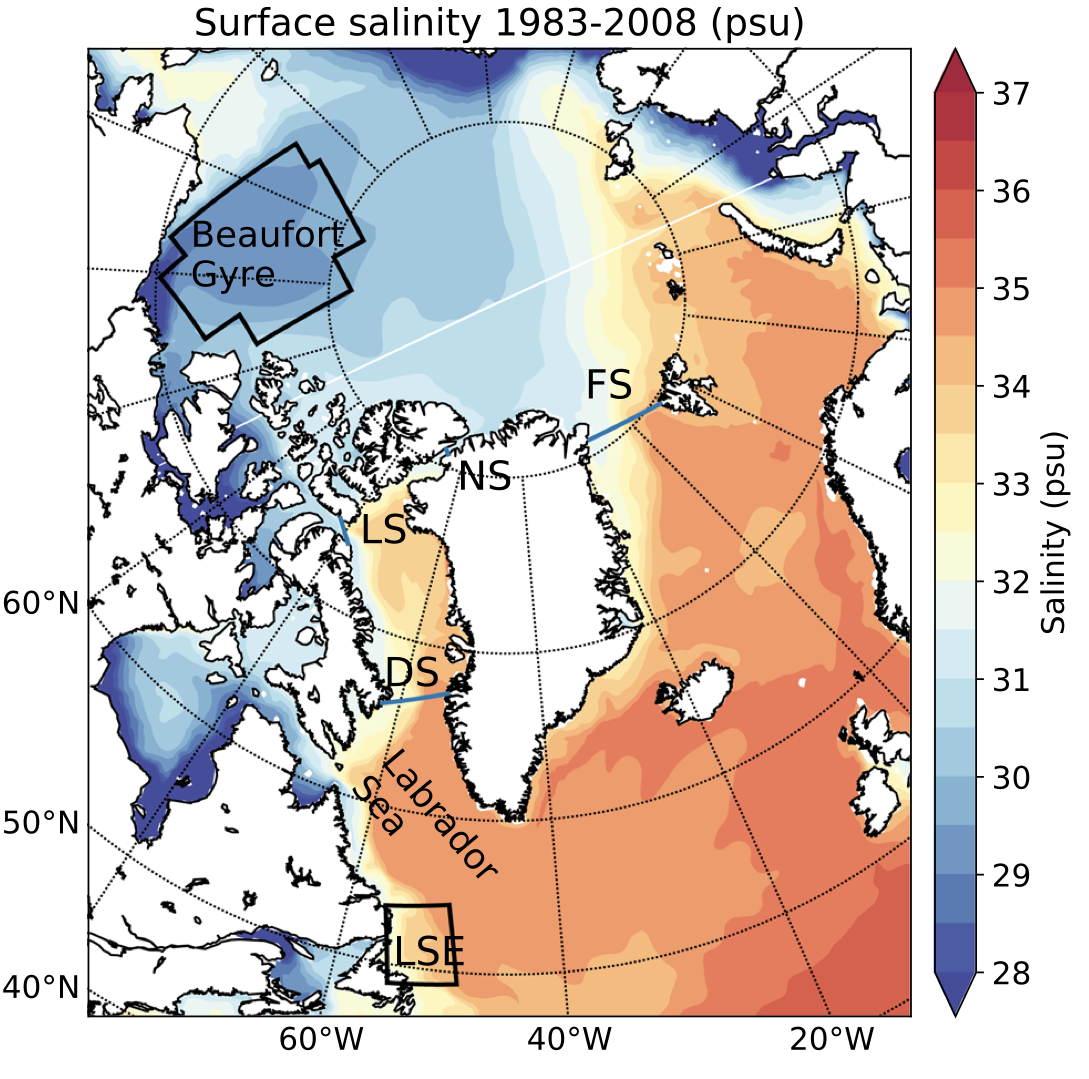
Climate change is slowly making our planet warmer, and as a result, polar ice caps are melting (Figure 1). In the last few decades, the extent of Arctic sea ice in particular has declined by 10%, and the fresh water stored in all that missing ice has been released into the ocean. This extra water leads to sea level rise, but because it’s primarily fresh water, it also makes the Arctic Ocean less salty. In the last 20 years, the freshwater content of one specific region of the Arctic Ocean – the Beaufort Gyre (Figure 2) – has increased by 40%!

The Beaufort Gyre is a special environment, because it concentrates a lot of fresh water in the Arctic. Fresher, lighter pockets of water tend to float at the surface of the ocean before they mix, and the clockwise wind patterns in the Beaufort Sea push the lighter water up into a shallow dome. When those winds relax – as they occasionally do – the dome flattens, and the fresh water escapes the confines of the Beaufort Gyre. From there, it flows into the rest of the Arctic, and ultimately into the North Atlantic.
Modeling Ocean Salinity and Circulation
Much of the previous research on the Beaufort Gyre has been focused on why the fresh water is building up in the first place. Fewer scientists have focused on the fate of fresh water after it leaves the gyre. A group of scientists from the University of Washington, the National Oceanic and Atmospheric Administration (NOAA), and the Los Alamos National Laboratory teamed up to figure it out.
Using an ocean circulation model, the team studied a freshwater release event that occurred between 1983 and 1995. They used two types of tracers – a virtual dye tracer and a salinity tracer – to simulate where the fresh water was going. The tracers represented two important components: the volume of Beaufort Gyre water in each grid of the model (the dye tracer), and the salinity of the water (the salinity tracer).
Modeling the movement of fresh water in the Arctic can be difficult, however. Most ocean circulation models operate at resolutions of 1º latitude and longitude, and are too coarse to simulate the complexity of the channels from the Arctic to the Atlantic. Using a coarse model like this would be akin to building a true-to-size model of a goldfish with Legos. You could do it, but the result wouldn’t be pretty or useful – nor would it be particularly helpful if you were trying to figure out how a goldfish breathes underwater. Therefore, the ocean circulation model used by the UW-NOAA-Los Alamos team operated at higher resolutions (1/3 of a degree latitude and longitude).
The new high-resolution model showed the researchers both the numerical change in salinity that could be expected in specific areas of the ocean, as well as which routes the fresh water was taking into the North Atlantic. Previously, freshwater transport was thought to happen through the Fram Strait (between Greenland and Svalbard, Norway; Figure 2) because it’s larger and wider. However, the model showed that between 1983 and 1995, most of the Beaufort Gyre fresh water actually reached the North Atlantic through the Canadian Archipelago and Davis Strait (west of Greenland). During this time salinities in some parts of the North Atlantic, such as the Labrador Sea, dropped 0.2 parts per thousand, which led to an event in the 1990s called the Great Salinity Anomaly.
The concentration of fresh water in the Beaufort Gyre is currently twice the volume before the modeled 1983-1995 event, causing researchers to warn that future drops in salinity from Beaufort Gyre fresh water could also be twice as low.
A Fresh Take on Freshwater
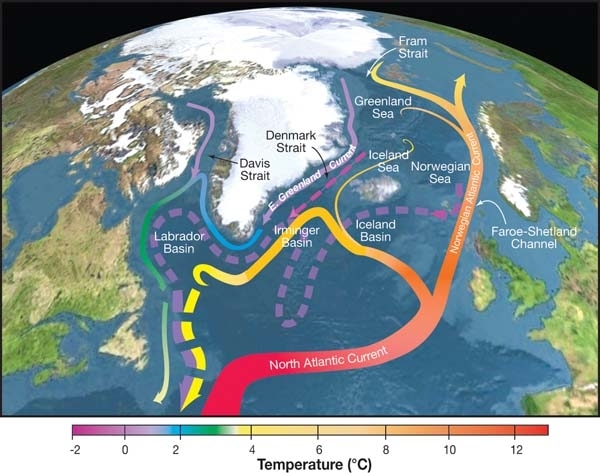
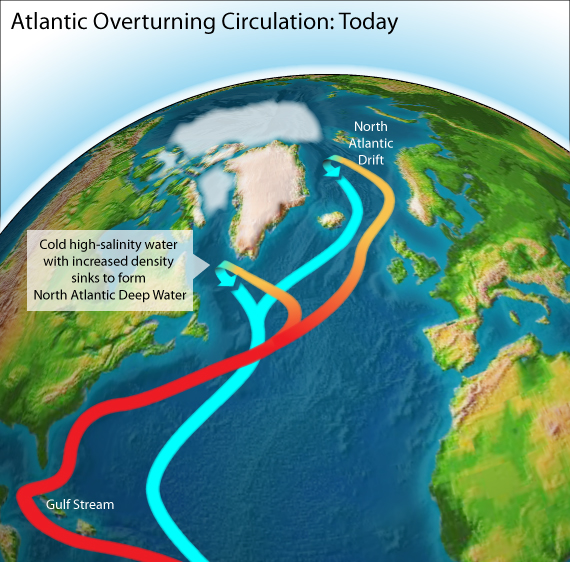
Not only does the freshening of the North Atlantic threaten the local marine ecosystem, it also may threaten water circulation throughout the entire ocean. A major circulation pattern, called the Atlantic Meridional Overturning Circulation (AMOC) exists in the Atlantic, and consists of shallow, northward-flowing water from the equator, and deep, southward-flowing water from the poles (Figure 3). These two currents of water form a sort of conveyor belt. In the North Atlantic, warm equatorial water typically gets colder and denser as it moves northward (Figure 4). The density difference causes it to sink to the bottom of the ocean, pulling more warm water from the equator to take its place at the surface. The conveyor belt of ocean currents generated here spans the globe.
If water in the North Atlantic gets less salty and less dense, that may impair its ability to sink. AMOC could slow down as a result, affecting temperatures across the entire northern hemisphere. Sophisticated, high-resolution models like the one developed by these researchers continue to reveal new clues about ocean circulation patterns – and warn against the escalating threats of climate change.
[hr]
I’m a PhD candidate in Earth System Science at Stanford University, and I study how microbes in deep ocean sediments produce and consume greenhouse gases. I’m a native of the landlocked state of Minnesota, so I’ve always been fascinated by the ocean. When I’m not in the lab, I love to race triathlons, forward “The Onion” articles to friends and family, and hike with my hound dog Banjo.
