Reviewing Article: Tierney, J.E., Zhu, J., King, J. et al. Glacial cooling and climate sensitivity revisited. Nature 584, 569–573 (2020).
The Last Ice Age
20 thousand years ago, our planet’s climate was very different. Woolly mammoths roamed the Earth and island of Manhattan was under half a mile of ice. Known more commonly as the last ice age, climate scientists refer to this period in Earth’s history as the Last Glacial Maximum. A large topic of research in climatology is understanding how our planet naturally transitioned from a cold, icy climate of the Last Glacial Maximum to the temperate climate we are living in today in just a few thousand years. However, before we can properly study the complexities of this natural global warming, we have to accurately pin down how cold it actually got during the ice age 20 thousand years ago.

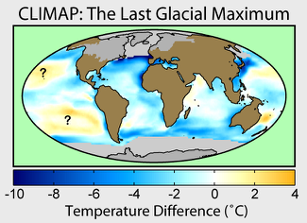
Unsurprisingly it’s actually been quite a challenge to figure out temperatures from such a long time in the past. One of the largest efforts to determine global sea surface temperatures during the last ice age was conducted in the 1970s, a project known as CLIMAP. Scientists in CLIMAP used the taxonomy of planktons to reconstruct seawater temperatures everywhere during the Last Glacial Maximum and predicted that average ocean temperatures were 1.2 degrees Celsius cooler than today. Though a really monumental effort, CLIMAP has since come under criticism for flaws in the methods (more on that below). Dr. Jessica Tierney and others recently published in Nature last month where they revisit the problem of ice age temperatures, this time combining new geochemical methods and global climate models to create a much more accurate reconstruction of the last ice age.
The Problem with CLIMAP
Back in the 1970s when oceanographers and climate scientists attempted to tackle this ice age question, the best way of determining sea surface temperatures was by using “foraminifera assemblages.” Very briefly, foraminifera, or forams for short, are small planktons that are found almost everywhere in the shallow ocean. We’ve discovered over 4 thousand different species of forams so far, each with their own preference for temperature, water depth, nutrients ect. Because of temperature plays a large role in how “happy” a foram species is, scientists have found relationships between sea surface temperature and foram species abundance.
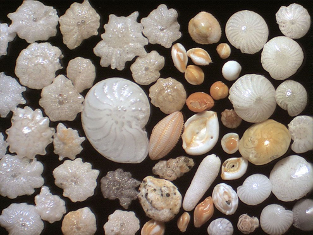
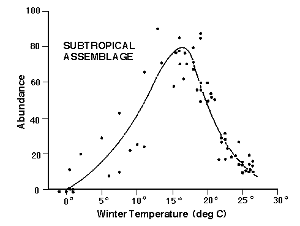
For example, certain species of subtropical foraminifera are most abundant at water temperatures of around 15 degrees Celsius (see below). By identifying the groupings or assemblages of foram fossils in the sediments dated to the last ice age, the CLIMAP team estimated seawater temperatures at hundreds of locations during this key time.
Though it’s an innovative method, foram assemblages are not without their flaws. For one thing, temperature is rarely ever the only control of foram abundance in a sample. Nutrient availability, predators, and seawater chemistry can all affect what species are present. Another factor is that when CLIMAP scientists looked through Last Glacial Maximum sediments to identify the foram species, sometimes they would come across a species that became extinct and no longer existed in the modern ocean. They would have no way of calibrating that species to a seawater temperature in this case.
Blending geochemical data and climate models
With all the shortcomings of the CLIMAP project, Dr. Tierney and her team decided that was worth revisiting this problem with updated methods and tools. Thanks to advancements in geochemistry, we’ve developed several new ways of estimating past seawater temperatures that don’t depend on plankton taxonomy. They range from biomarkers secreted from marine organisms to elemental ratios in foram shells. All of these geochemical methods have their own weaknesses and strengths just like foram assemblages, but the hope is that when used together, they can help paint a clear picture of global temperatures during the last ice age.
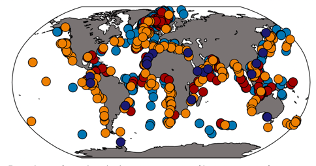
Dr. Tierney and others assimilated almost one thousand measurements of ice age sea surface temperatures from around the global oceans. And while that sounds very impressive, it doesn’t come close to covering the entire globe. To fill in the large gaps between the data, the authors fed a global climate model with geochemical temperature estimates. This way they have the spatial coverage of a global climate model with the accuracy of geochemical records made from the real world, the best of both worlds.
Revisiting the glacial cooling
So how much did our planet cool according to this blended data/model assimilation? According to Dr. Tierney’s paper, it’s estimated that the last ice age was cooler on average by about 3 degrees Celsius. This is a much larger cooling signal than the CLIMAP result of 1.2 degrees Celsius. Because CLIMAP actually predicted unreasonable warming temperatures during the last ice age in some parts of the tropics, which this model/data result does not show, Tierney and coauthors believe the cooler average temperatures are encouraging and show that we are making progress in the right direction.
This effort of combining new techniques in analytical chemistry and computer modeling has helped us obtain a much better picture of the last ice age. With a more accurate baseline of the Last Glacial Maximum, we can begin to accurately study the various effects of global warming of 3 degrees Celsius, an effort that will be crucial for predictions of climate change impacts today.
I am a PhD student studying climate physics and marine geology at MIT and Woods Hole Oceanographic Institution. I am interested in using geochemical methods and climate models to study periods of rapid climate change in the past and understanding the ocean’s role in our climate system. In my free time I enjoy tennis, boardgames, and recreating my favorite asian foods at home.
