Article: Recent changes of global ocean transparency observed by SeaWiFS. Xianqiang He, Delu Pan, Yan Bai, Tianyu Wang, Chen-Tung Arthur Chen, Qiankun Zhu, Zengzhou Hao, Fang Gong. Continental Shelf Research 143, 2017, 159-166
Measuring how deep sunlight reaches in the ocean

Particles in water scatter light. The more particles there are the shallower the photic zone and the maximum depth you can see. In the ocean, the photic zone is the depth that sunlight can penetrate. This is important because that limits the depth of photosynthesis. The water clarity or transparency as a result of the amount of particles present can be measured in a variety of ways.
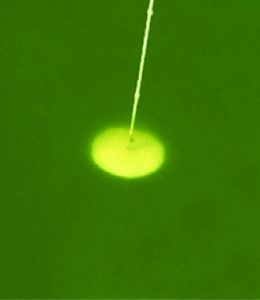
The Secchi Disk is a simple tool used to measure water clarity in fresh and sea water. It is easy and cheap to use. Essentially it is a white and black disk, attached to a rope and lowered in the water (Figure 1). The depth where you can’t see the disk anymore is the Secchi Disk depth. This measurement technique has been used for over 100 years and is still used today. In recent years, satellite data is used to observe ocean water clarity. The Secchi Disk depth is still the parameter used to quantify ocean clarity even when the physical disk isn’t used. Recently, researchers have been working on combining the Secchi Disk data to satellite sensors.
Measuring this depth from space!
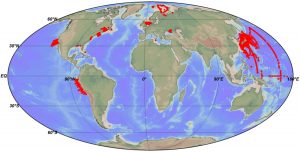
One of these satellite sensors is the Sea-Viewing Wide Field-of-View Sensor (SeaWiFS). SeaWiFS was operational from September 1997 until December 2010. SeaWiFS observed the ocean color from space and interpreted the color to the amount of photosynthesis (defined by chlorophyll a or Chl a) occurring at the ocean surface. The greener the ocean water, the more phytoplankton in the water. Researchers used SeaWiFS data from September 1997 to November 2010 to calculate the Secchi Disk depth and validated it with Secchi Disk measurements taken during the same period (Figure 2). Determining the water clarity in the ocean on a global scale is useful. It tells researchers about light availability for primary production in both the surface and bottom water especially near the coast. Using satellite date over multiple years can also tell researchers about long term trends in water clarity and primary production.

Spatial Patterns
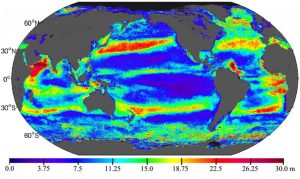
In the open ocean water clarity is linked to primary production (photosynthesis) and near coasts it is also controlled by terrestrial input. The deepest Secchi Disk depth found was more than 40 meters in the ocean gyres where there is limited primary production. Figure 3 shows the global average Secchi Disk depth for the whole sample period. It is much shallower near the coasts (less than 20 meters) which could be due to terrestrial input or upwelling. Along the west coast of the Americas the Secchi Disk depth is less than 15 meters. These areas are strong upwelling regions which lead to more primary production.

Temporal Patterns

The seasonal variation was also determined as the difference of the maximum and minimum Secchi Disk depths throughout the year (Figure 4). The greatest change was near 30oN and 30oS which is between the subtropical gyres and the high latitude region. This difference is a result of seasonal changes in fronts in these regions. Other changes could be due to large seasonal phytoplankton blooms such as those near India due to the monsoon season (a 30 m change in Secchi Disk depth). It could also be due to seasonal changes in river discharge as seen from the Amazon River in the equatorial Atlantic Ocean. When rivers discharge into the ocean they move a lot of sediment and organic matter from land into the water which decreases the water transparency and therefore the Secchi Disk depth.
Inter-annual Variation
From 1997 to 2010, the Secchi Disk depth increased in the Northern Hemisphere and decreased in the Southern Hemisphere. One area in the Northern Hemisphere that saw an increase in the Secchi Disk depth was the northern Atlantic Ocean. This was linked with a decrease Chl a that is likely due to increasing stratification. Stratification occurs when water is unable to mix and in this case the deep cold, nutrient water cannot mix with the warm surface water where the nutrients have been used up. This means that the nutrients needed by phytoplankton are not available. Even if there is enough sunlight reaching the ocean if the nutrients aren’t available there can be no primary production. The decrease in the depth in the Southern Hemisphere was connected to an increase in primary production.
Conclusion
As mentioned above, the Secchi Disk depth influences primary production. It measures the part of the ocean with enough sunlight to allow photosynthesis. It is also important in coastal zones as an indicator of water quality impacted by terrestrial inputs. A deeper Secchi Disk depth in coastal waters ensures there is enough light for bottom, or benthic, primary production from sea grasses, corals, and plankton. The ability to see this from space, along with fine scale measurements with the disks in situ, can be used to monitor the changes in water transparency all over the globe. This baseline of the last 13 years will become increasingly important as stresses to marine ecosystems increase as the ocean warms. Using satellite data to monitor global water transparency will help researchers know where to conduct in situ studies to better understand how the Secchi Disk depth impacts surface and benthic primary production.
I am a PhD candidate at the Graduate School of Oceanography at the University of Rhode Island. I am an atmospheric chemist studying organic acids in the troposphere to better understand their role in ozone processing. I flew on a Gulfstream V and a C-130 all in the name of science!


Many thanks for writing down these information. it helps me a lot😭