Source: Thompson, P. R., Hamlington, B. D., Landerer, F. W., & Adhikari, S. (2016). Are long tide gauge records in the wrong place to measure global mean sea level rise?. Geophysical Research Letters.
Flooding coastlines
In La Jolla, California where I work, winter storms and high tides bring waves that batter against the the walls of million dollar homes and restaurants along the beach. Right now this only happens a few times a year so businesses and homes can cope with it, but imagine what it would be like if it happened 10 times a year? Or every time there was a storm?

This is the reality of sea level rise, not just in San Diego, but in coastal communities around the world, which are home to 40% of the world’s population and many billions of dollars of property. Sea level rise is placing these coastal cities, communities and ecosystems at risk, as the chance of extreme flooding events during storms increases dramatically with a higher mean sea level.
Rising waters
As greenhouse gases trap excess heat on Earth, the ocean is warming and expanding, and ice sheets and glaciers are rapidly melting and flowing into the oceans. This is causing sea levels to gradually rise, at rates of millimeters a year, which seems small, but is predicted to rise more rapidly in the future, and could result in several feet of sea level rise within our lifetimes. In order for communities to adapt and prepare for sea level rise, they need scientists to provide accurate predictions of current and future sea level change. But measuring current sea level changes accurately around the globe is a vast challenge with about 372,000 miles of coastline in the world. If sea level rise was the same everywhere in the ocean, like a bath filling up, then we could just measure it in one location. However, sea level rise can actually be much faster in in some parts of the global oceans than others. These local variations depend on ocean circulation, land masses moving up or down, and changes in Earth’s gravity field from melting of ice sheets and glaciers.
A group of researchers at the University of Hawaii have been tackling this challenge for years, running a global network of tide gauges, which measure the sea level changes very accurately over hours, days, months, and years. However, the tide gauges take money and work to maintain, so really are scattered in only a handful of places around the world.
In the past, researchers assumed that the error due to the fact that the tide gauges only sample a few places along coastlines around the world is completely random. Therefore if they average the records together, the higher and lower sea level rise trends at the individual tide gauges would compensate for each other, giving an accurate global average. However, the tide gauges aren’t distributed evenly across global coastlines, so there is a reasonable chance that they may be consistently underestimating or overestimating sea level rise. For example, if there were more tide gauges along the east coast of the US than the west coast, and sea level is higher on the east coast than the west coast, then the average sea level rise calculated from the tide gauges would be higher than the truth. In this study, researchers at the University of Hawaii dived deep into the sea level record to determine for the very first time if they were accurately estimating global sea level rise from tide gauge data.
Tracking the tides

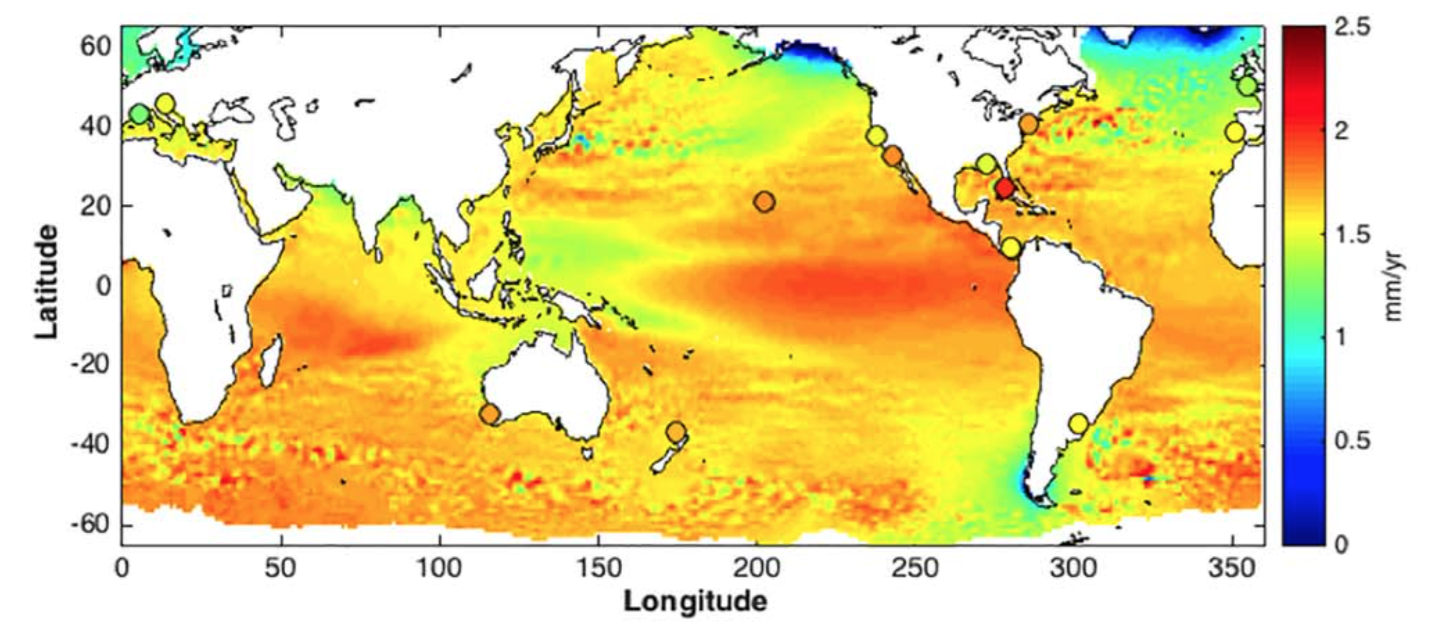
The scientists started by gathering together 15 of the longest running, highest quality tide gauge records from all over the world. These records show an average sea level rise trend over the 20th century of 1.57 mm each year, after being adjusted for vertical motion of continents. However, there is a big range in trends at different locations, with the fastest sea level rise at Key West in Florida, and the slowest at Marseille in France. With these 15 tide gauge records, the researchers explored how the two main things affecting sea level patterns – the melting of ice sheets and glaciers and changes in ocean circulation – might be unevenly sampled by tide gauges.
Too high or too low?
First, the scientists looked at how the sea level fingerprint of ice melting from Antarctica, Greenland and glaciers around the world is sampled by the tide gauges. When ice melts and flows into the ocean, you would expect that sea level rises because more water is being added to the ocean. But surprisingly, sea level actually drops close to the ice melt, because gravity is pulling the ocean upward toward the land, but if you remove mass from the land by melting ice, the gravitational pull is weaker, and the water level drops slightly. This creates a ‘fingerprint’ from the ice melt with lower sea levels close to the ice source, and higher sea levels far away. The researchers looked at how well the tide gauges measure the global fingerprints of ice melt, and actually found that they could be underestimating sea level. There are more tide gauges in the Northern Hemisphere, and sea level is lower in the Northern Hemisphere than the Southern Hemisphere because of rapid ice melting of Northern Hemisphere mountain glaciers, so the average from the tide gauges is lower than the real global average.

Looking at a group of climate models for the 20th Century, the researchers took a similar look at changes at the effects of ocean circulation changes on sea level. They found that ocean circulation sea level patterns had very little effect on how well the tide gauges sampled global sea level.
Combining this information, the researchers came up with a distribution of the expected ‘true’ global average sea level rise trend, and compared it to their tide gauge estimates and estimates from other studies. What they actually found is that rather than overestimating sea level trends, like some recent studies suggest, the tide gauges could be underestimating the rate of global sea level rise. This means that sea level in the 20th Century could have risen faster than we previously thought, which means our future predictions of sea level change could be in doubt.

This research shows that there are still big challenges in our ability to record how Earth’s climate is changing, and more work is needed to get accurate records and predictions for cities and communities to adapt to change.
I’m a PhD student at Scripps Institution of Oceanography in La Jolla California. My research is focused on the Southern Ocean circulation and it’s role in climate. For my research I sometimes spend months at sea on ice breakers collecting data, and at other times spend months analyzing computer models.