Source: Huhn, Oliver, Monika Rhein, Torsten Kanzow, Janin Schaffer, and Jürgen Sültenfuß. “Submarine Meltwater From Nioghalvfjerdsbræ (79 North Glacier), Northeast Greenland.” Journal of Geophysical Research: Oceans 126, no. 7 (July 2021). https://doi.org/10.1029/2021JC017224.
Rising seas from melting ice
When it comes to understanding the impact that humans have on Earth, sea level rise is a big concern. Many of us have seen news articles about huge ice sheets breaking from glaciers and sliding into the ocean. But only in the past few decades has modern technology allowed more researchers to brave the Arctic chill and figure out exactly where our glaciers are going.
Greenland is the world’s largest island, located within the Arctic circle. The frigid climate has caused about 80% of the landmass to be covered with ice. But this isn’t just a stagnant ice sheet. It is composed of hundreds of glaciers that move, melt, and freeze. The “marine-terminating” glaciers that protrude into the ocean have gained attention as researchers seek to understand the interactions between ice and oceans that may change due to global warming.
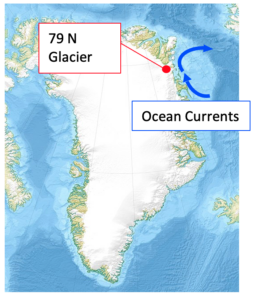
When thinking about sea level rise potential from Greenland, the 79 N glacier is the elephant in the room. It is the largest marine-terminating glacier in Greenland, larger than New York City! In 2016, researchers from the University of Brennen set out to study sea level rise contributions from this massive glacier. But studying sea level rise isn’t always as simple as watching big ice sheets fall into the ocean. We may not be able to see the slow melt of ice into the ocean, but it results in gradual sea level rise nevertheless.
Tracking Glacial Melt through Ocean Soup
If I gave you a bowl with hot broth, chicken, and noodles, you would see those ingredients and immediately identify it as chicken soup. In a similar way, the researchers were able to analyze the “ingredients” of seawater to understand where that water came from. Except the ingredients they used were Neon and Helium gas. They did this using an instrument called a mass spectrometer. The spectrometer sorts the elements in the water out by their weights. Because scientists know the weights of different elements, they can find the concentration of elements in the water. The researchers collected water at 69 different locations along the 79 N glacier. At each location, water was collected at about 10 depths, for a total of 650 water samples.
Melting from Below
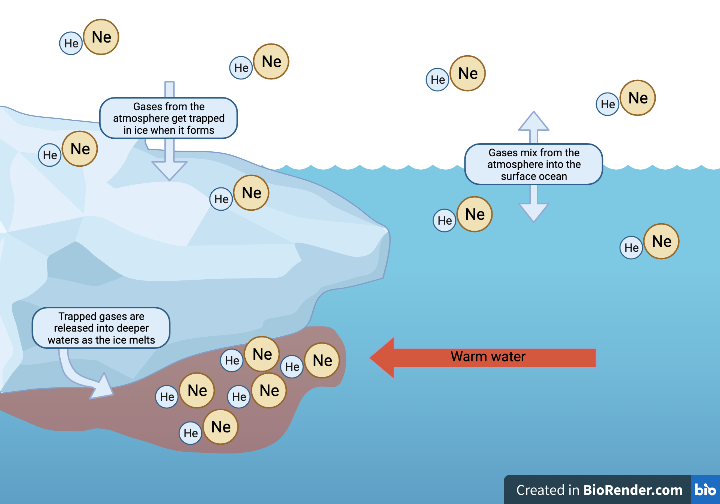
The figure below shows the high levels of neon (Ne) and helium (He) gases found in deep waters nears the glacier. These measurements contrasted lower levels in the surface ocean, atmosphere, and ice. This indicated that gases trapped in ice were being released and concentrated under the glacier. These measurements also coincided with higher water temperatures. The warmer temperatures showed that warmers waters from the Atlantic ocean were coming under the glacier and melting it from below! Compared to similar research focused on other glaciers, the values of neon and helium were much higher. They estimated that the 79 N glacier is melting at a rate of 8.6 meters per year. This confirmed their hypothesis that the largest marine-terminating glacier in Greenland would be contributing the most to glacial melt.
Researchers took advantage of the neon and helium gases not just to identify where the glacial melt was coming from, but also where it was going. As meltwater moves away from the glacier, it mixes with surrounding ocean waters. This causes the concentrations of neon and helium to decrease. Following these decaying concentrations, researchers found that glacial melt traveled northward with the major ocean current in the area. They also found that the signal of meltwater was negligible past the shelf of Greenland. This is a promising result for scientists concerned about the impact of glacial melt on open-ocean circulation.
Neon and Helium save the day
While the news covers dramatic glaciers collapsing into the ocean, neon and helium are the unsung heroes explaining the importance of gradual glacial melt. Researchers measured these gases to find that the largest marine-terminating glacier in Greenland is melting from below. They found that the meltwater signal was strongest near the coast, and negligible towards the open ocean. They were also able to calculate a melt rate of 8.6 meters per year, equivalent to less than a few millimeters of sea level rise. While this may seem like a small amount, every little bit adds up. Future research using this method on more glaciers both in Greenland and Antarctica will help us prepare our coastal cities for rising sea levels.
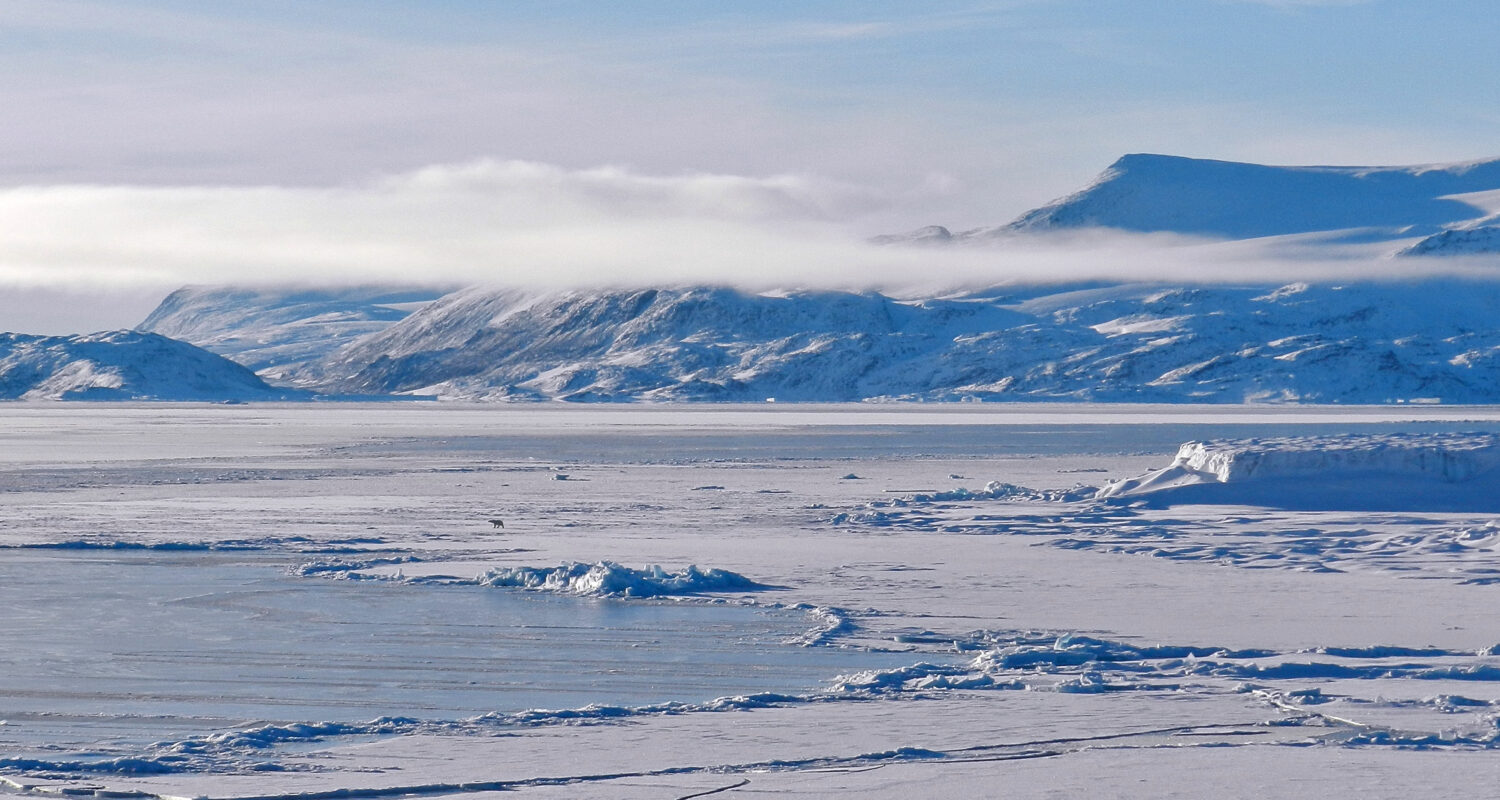
Cover photo under creative commons license from European geosciences union

I’m a first year PhD student in Physical Oceanography at the University of Rhode Island. I’m currently combining active-imaging remote sensing data with in-situ measurements to characterize under-ice phytoplankton blooms in the Arctic. I love thinking about how physics and biology interact and are impacted by climate change. In my free time I love running, rowing, and skiing!