Source: Chatterjee, A.; Gierach, M. M.; Sutton, A. J.; Feely, R. A.; Crisp, D.; Eldering, A.; Gunson, M. R.; O’Dell, C. W.; Stephens, B. B.; Schimel, D. S. Influence of El Niño on atmospheric CO2 over the tropical Pacific Ocean: Findings from NASA’s OCO-2 mission, Science 2017, 358 (6360). DOI: 10.1126/science.aam5776
Most of us are familiar with the effects on El Niño on our local climate. During the 2015-2016 El Niño, I dejectedly discovered that the only waterproof shoes I owned were flip flops, and braced myself for days of soggy feet in southern California. More than 8,000 miles away, the people of Southeast Asia were enduring much more serious consequences, coughing through smoke from major peat and forest fires due to the warm and dry conditions brought on there by El Niño (Figure 1).

But the influence of El Niño is wider than regional weather patterns; El Niño has significant effects on the global climate system, and further, the global carbon cycle. The link between El Niño and carbon is clear: during El Niño, there’s a marked rise in CO2 levels in the atmosphere. But eluding scientists has been actually quantifying the impact of El Niño on the carbon cycle. That is, until now.
Scientists at NASA are reveling in the extensive dataset provided by one of their most recent satellites, the Orbiting Carbon Observatory-2, or OCO-2 (Figure 2). This satellite makes measurements of atmospheric CO2 levels, measurements that are clear and accurate enough to show exactly when and where atmospheric CO2 levels change.
But first, to understand the connection between El Niño and rising CO2 levels, it’s essential to know what is actually happening when we say we’re in an El Niño event.

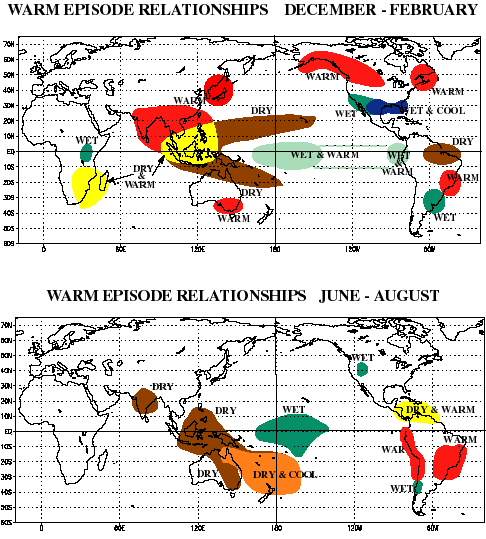
Under normal conditions, the trade winds blow across the equator from South America towards Southeast Asia. These winds mix around the ocean waters beneath them such that cold, deep, CO2-saturated water is brought to the surface near the western coast of South America, releasing carbon dioxide into the air. Though the explanation of the causes and feedbacks of El Niño could go on forever, here’s the quick and dirty: every five to seven years or so, these trade winds weaken and trigger what we call “El Niño,” causing disruptions to natural patterns of wind and rainfall in regions around the world (Figure 3).

The prevailing hypothesis explaining why CO2 rises during El Niño has to do with processes in both the ocean and land. First, due to the weakened trade winds, less of the cold, carbon-rich water makes it to the ocean surface, suppressing the amount of CO2 the ocean would normally release to the atmosphere. On the other hand, during El Niño, Southeast Asia experiences unusually warm and dry conditions. These conditions cause fires through large swaths of forests and peat bogs that release an immense amount of carbon dioxide into the atmosphere, dwarfing whatever reduction in oceanic release of CO2 occurs during this time. While this scheme was generally agreed upon, the atmospheric CO2 data scientists were working with just wasn’t good enough to separate the competing influences between the ocean and land, and thus the hypothesis remained unconfirmed.
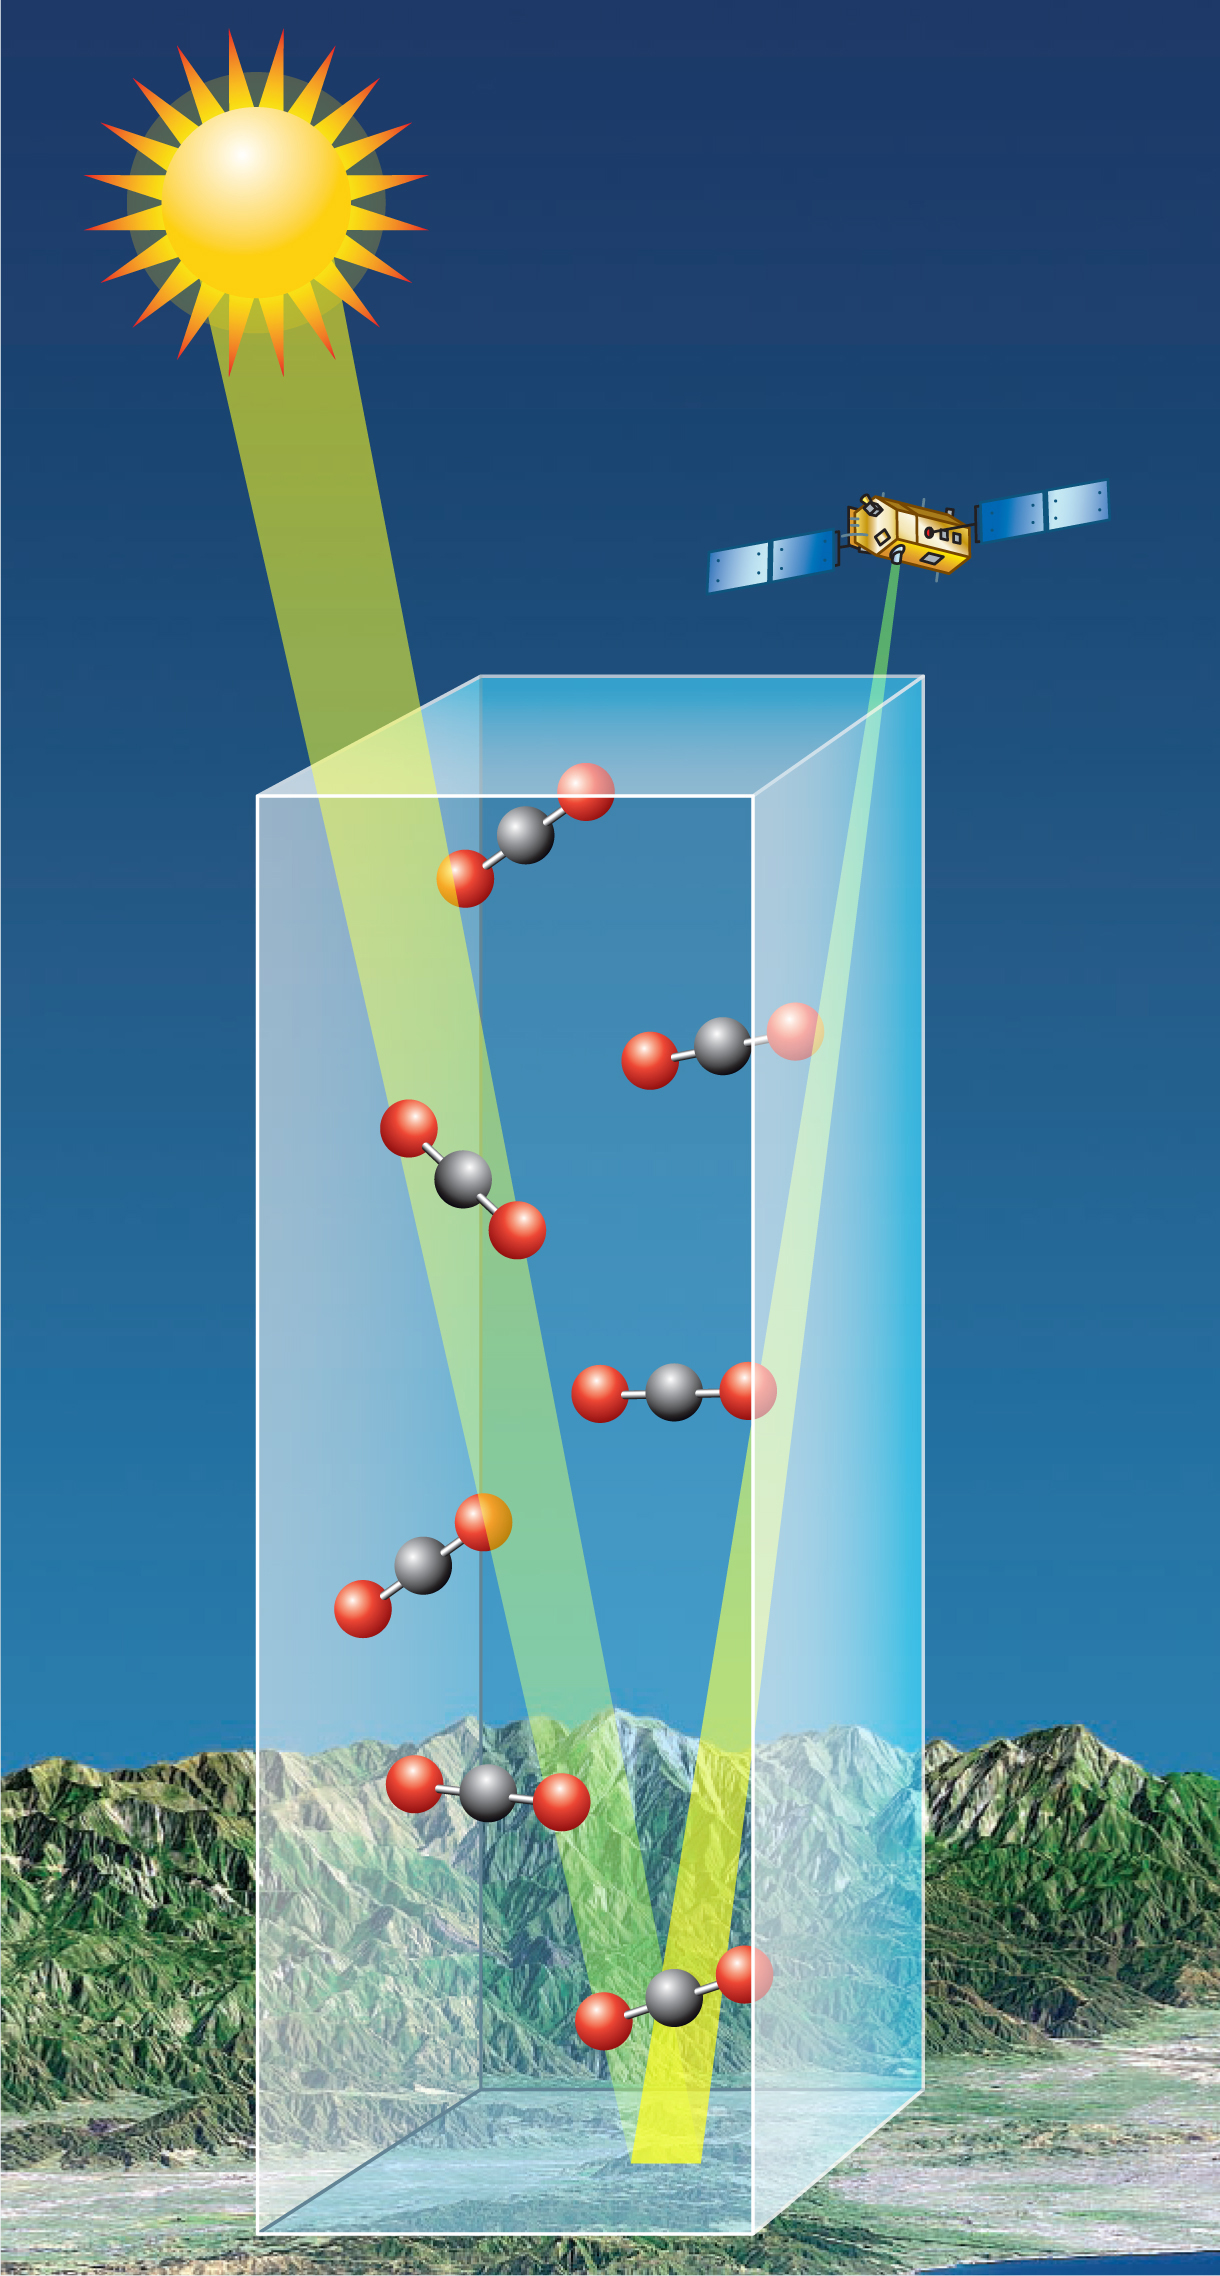
Which brings us back to the new OCO-2 satellite. Before OCO-2, carbon dioxide was only being measured at stations anchored at sparsely scattered locations, and the data from those fixed stations couldn’t distinguish between ocean and land processes affecting CO2 levels during El Niño. But NASA scientists decided to try something new. Rather than directly measuring CO2 concentrations in the atmosphere, they constructed a satellite that collected this data indirectly; OCO-2 instead measures how much light is being scattered off CO2 molecules in the air (Figure 4). Using a satellite allowed them to make measurements around the globe rather than at fixed locations. And at a measurement rate of 24 soundings per minute, OCO-2 gave them the information they needed to see how carbon dioxide levels were changing in time at specific locations across the globe.

In a huge stroke of luck, only one year after the 2014 OCO-2 launch date, one of the strongest El Niño events on record occurred. Thanks to their satellite, NASA got the data it needed to closely monitor CO2 levels at regional scales through the onset and duration of the 2015-2016 El Niño. The scientists finally had what they needed to confirm the prevailing hypothesis on the roles that the ocean and land play in CO2 levels during El Nino events.
The satellite data showed that during the onset of this El Niño (between March and July of 2015), the ocean was indeed releasing less CO2 into the atmosphere. The satellite dataset, validated by CO2 measurements collected by the NOAA Tropical Atmosphere Ocean (TAO) moored buoy array, showed a drop in CO2 levels over the tropical Pacific Ocean. But after August 2015, as El Niño persisted, the impacts on the land kicked in. Plants were taking up less carbon dioxide, and the warm and dry conditions set into motion significant biomass burning through Southeast Asia and Indonesia, releasing massive amounts of CO2 into the air. The data again captured the change in CO2 trends, showing a rise in CO2 concentrations over the Tropical Pacific during the second half of the El Niño event.
The pursuit to understand what determines atmospheric CO2 levels continues. In order to predict what our climate will look like in the future, we need to quantify all the processes, both natural and anthropogenic, that influence the amount of carbon dioxide in the air. The OCO-2 satellite gave the scientific community a big boost in the effort to identify the effects of El Niño within the greater climate system. This connection furthers our understanding of the natural processes that affect atmospheric CO2, and takes us another step towards understanding our planet and how it will change in the future.
Julia is a PhD student at Scripps Institution of Oceanography in La Jolla, California. Her focus is on biogeochemistry, which, as the name suggests, centers on the combined effects of biological, geological and chemical processes on the earth system. She is advised by Dr. Ralph Keeling and is modeling the global carbon cycle to better understand how much carbon dioxide ends up in the atmosphere. When not at her computer writing code, Julia can usually be found reading and/or thinking about food.

Thanks …..for making my concept clear .