Zhuang, H., Zhao, L., Wang, Z., Zhang, Z., Yang, L. Identifying global marine climate refugia through a conservative approach to ocean biodiversity preservation. Nat. Commun. 16, 10752. (2025). https://doi.org/10.1038/s41467-025-65791-z
Marine Biodiversity Conservation
You may have heard of 30×30. It is a global effort to protect 30% of Earth’s land and ocean by 2030. Adopted by over 190 countries, it represents the largest conservation commitment in history. But deciding where to place those protected areas is far from simple. Add in climate change, and the task becomes even harder.
Imagine setting aside a forest as a wildlife refuge only to discover decades later that rising temperatures have made it uninhabitable for the species you meant to protect. The same risk exists in the ocean. If we designate marine protected areas today, will those ecosystems still function as a safe habitat in a rapidly warming future?
Marine life, and the pressures it faces, are unevenly distributed around the planet. Regions near the equator and poles are expected to experience significant climate shifts. That means conservation planning cannot just focus on biodiversity hotspots for today; it must also consider where conditions will remain stable tomorrow to strategically protect the environment.
Current Ocean Protection Measures
Marine protected areas (MPAs) and other effective area-based conservation measures (OECMs) are currently the best tools for biodiversity conservation. Since the 30×30 target was formalized at the 2022 Conference of the Parties, scientists and policymakers have worked to identify conservation areas. A great deal of mapping has been completed, and a substantial effort has gone towards creating standard protected area selection criteria. Nevertheless, not all analyses incorporate climate shifts on a global scale.
Climate refugia, however, are areas that are expected to remain relatively stable even under severe climate change. Climate refugia function like air-conditioned rooms during heatwaves. These are the pockets that remain relatively stable while the outside becomes more extreme.
Identifying Marine Climate Refugia at a Global Scale
While some regional studies have mapped marine climate refugia, few have done so globally or combined climate stability with established conservation priorities. This gap is what a recent study by Zhuang and colleagues aimed to explore.
Zhuang and their team specifically sought to identify marine climate refugia on a global scale. They defined marine climate refugia using two criteria. First, an area had to remain stable under a worst-case, high emissions warming scenario. Second, it had to be a conservation consensus area, or an area where at least two globally representative marine conservation priority maps overlap, agreeing it is important for biodiversity. In other words, the refugia were places that were biologically important and likely to remain stable.
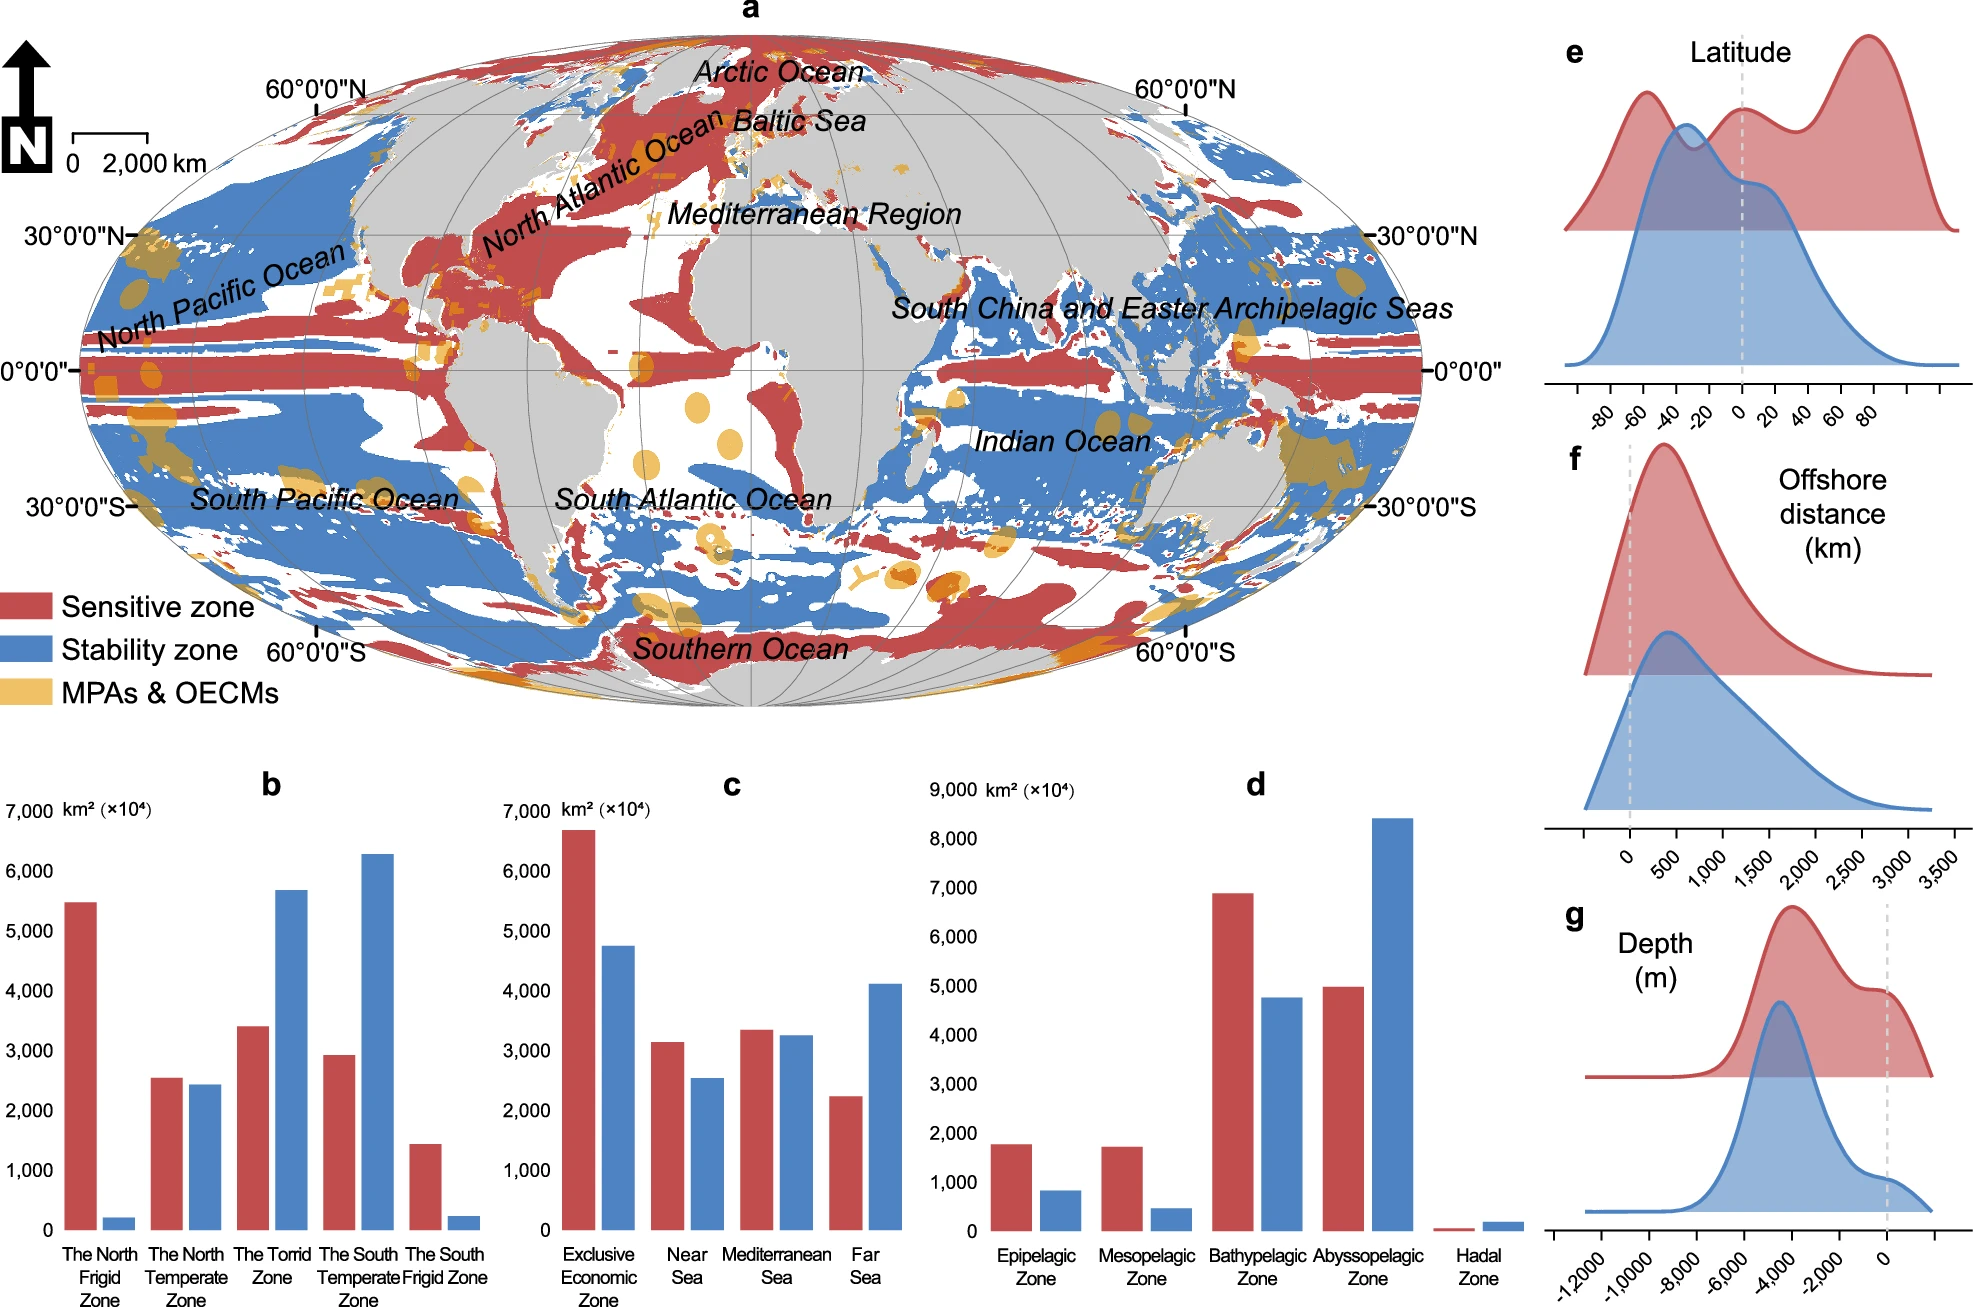
Under the high emissions scenario, about one-third of the ocean (36%) was classified as a sensitive zone, or an area expected to experience significant environmental change. These sensitive zones were concentrated in the Arctic Ocean, North Atlantic Ocean, and Southern Ocean (Figure 1). Another third (34%) of the ocean was considered a stability zone, or an area expected to remain relatively stable amid environmental pressures. These stability zones were located primarily in southern temperate zones.
Both sensitive and stability zones tended to shift towards land, especially within Exclusive Economic Zones (EEZs) and waters shallower than 1000 meters. Water very close to the shorelines was often classified as sensitive, while slightly deeper water areas had a mix of stability and sensitive zones.
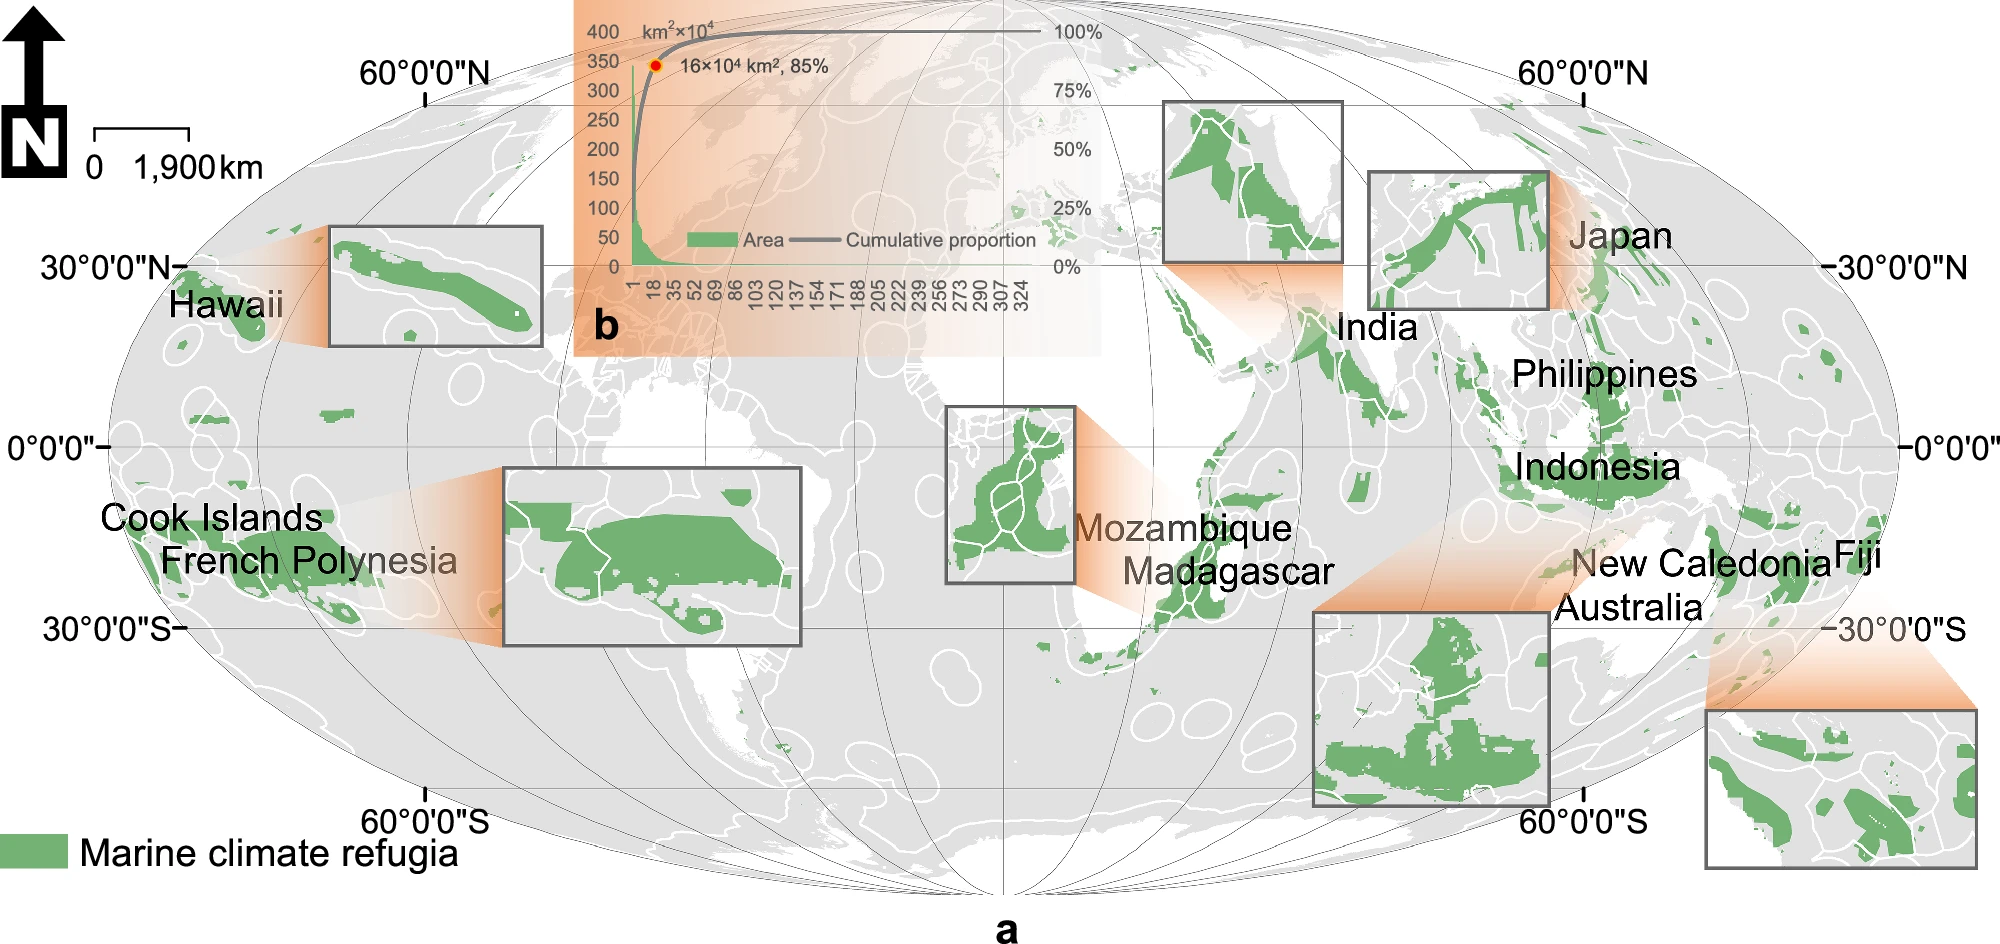
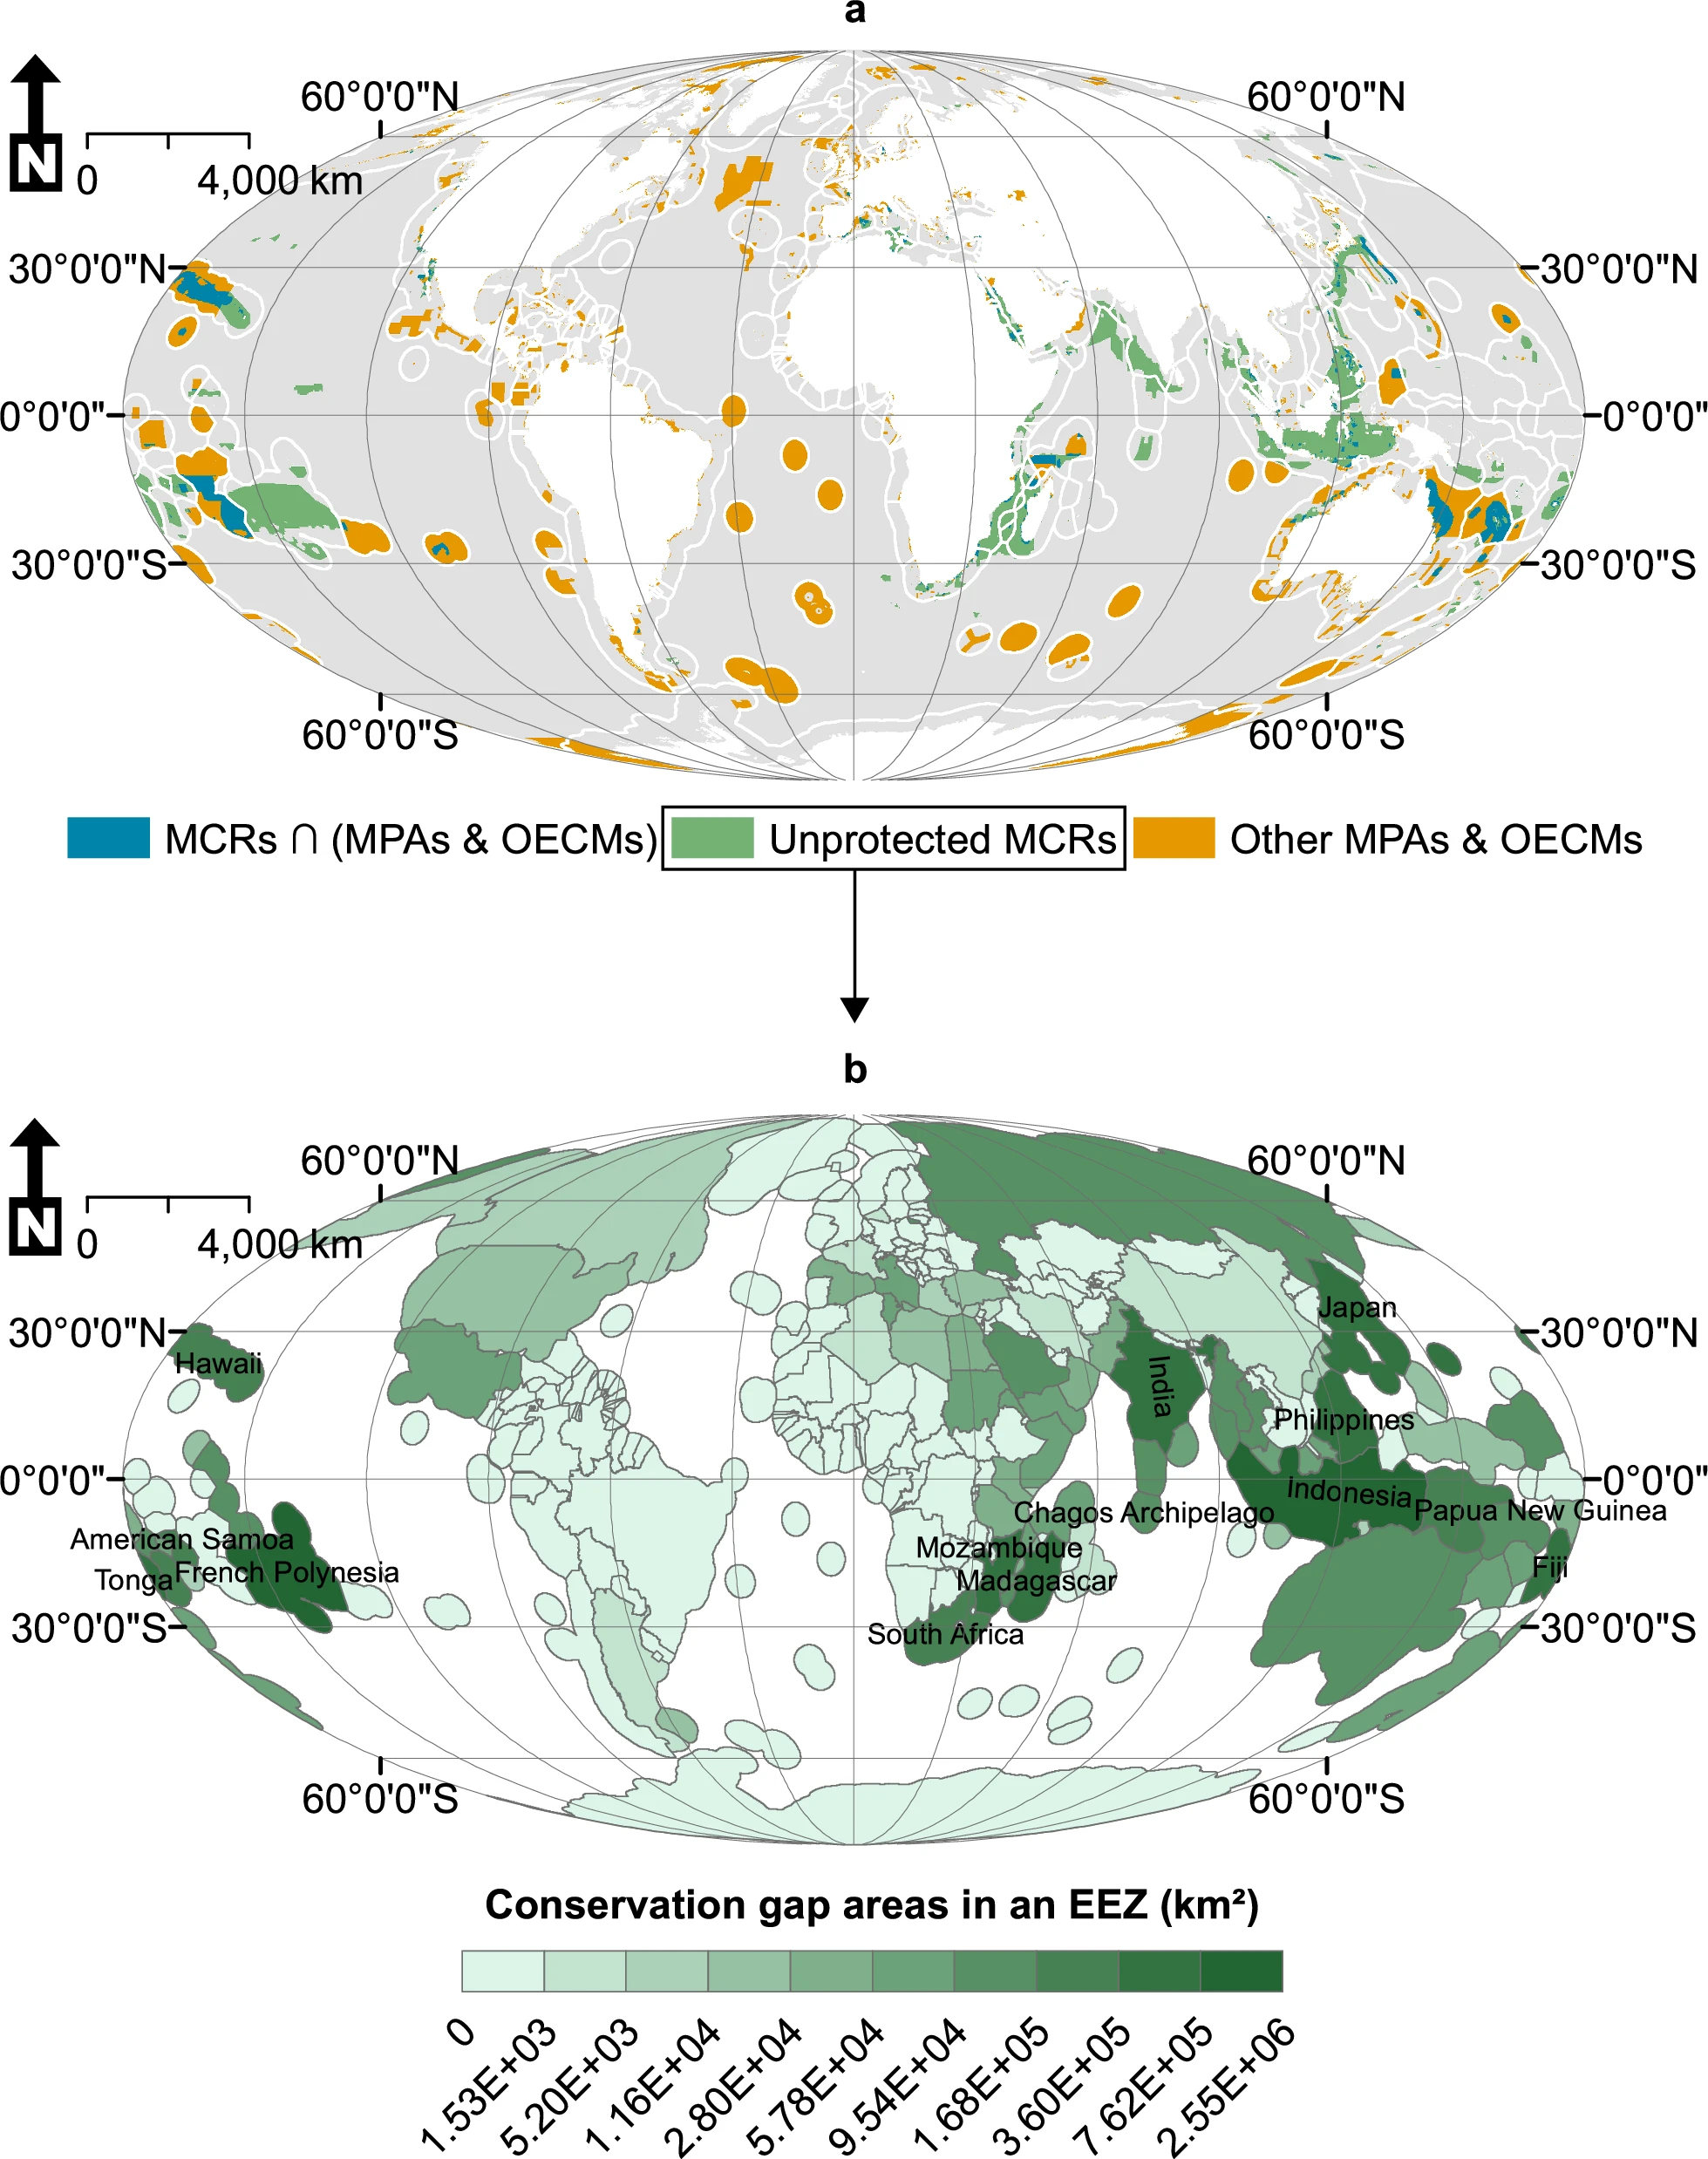
When the research team overlaid the climate stability zones and conservation consensus areas (areas where at least two marine conservation priority maps overlap), they identified marine climate refugia. They found that 50% of the conservation consensus areas located in the stability zones qualified as marine climate refugia (Figure 2) covering more than 17 million square kilometers. Strikingly, 96% of these refugia fell within an EEZ rather than the high seas. The largest concentrations occurred within the EEZs of Indonesia, French Polynesia, Hawaii, and the Philippines.
Conservation Gaps and Opportunities
Despite the importance of these marine climate refugia, most are not currently protected. The research team identified a 70% in situ conservation gap, meaning many climate-safe areas lack protection through MPA or OECM measures (Figure 3). However, the good news is that because nearly all identified refugia lie within EEZs, most marine climate refugia are within national jurisdiction. This does not remove all political conservation challenges, but it does make conservation more promising and feasible than action in the high seas.
Another challenge identified by the researchers was scale. Large-scale marine protected areas are generally more effective at preserving biodiversity. While only 6% of marine climate refugia met the large-scale size threshold, those patches accounted for 85% of the total refugia area. Many of these large scale refugia span multiple EEZs, meaning they cross national boundaries. Again, this creates challenges as well as opportunities for international collaboration in conservation management.
Importantly, the authors emphasize that marine climate refugia alone are not sufficient to meet 30×30 targets. Instead, they provide a strategic baseline to design, select, and implement sustainable management strategies for biodiversity conservation.
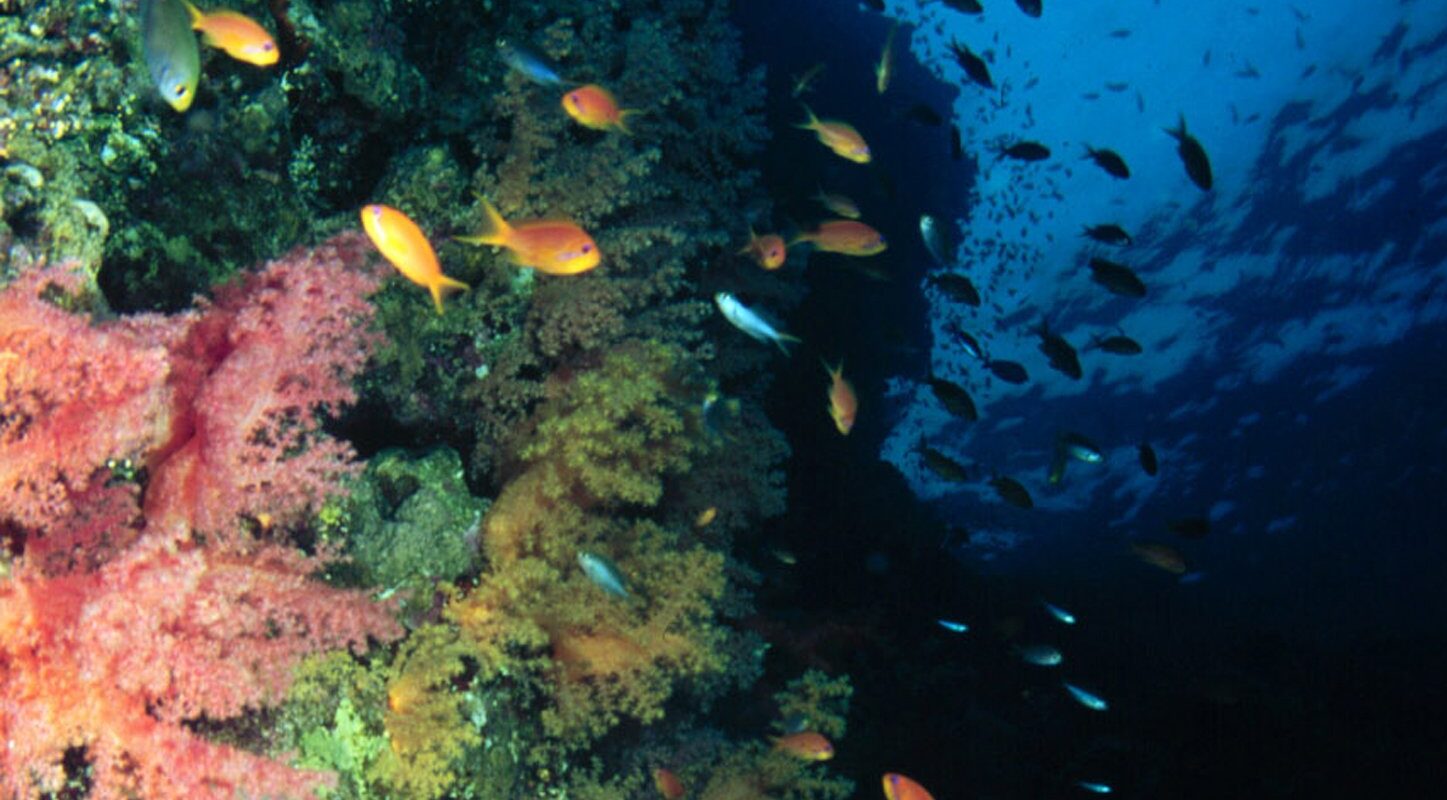
Cover image is sourced from the 2007 NOAA Ocean Expedition Twilight Zone Expedition Team. Image depicts a vertical wall reef in the Indo-Pacific region that it a biodiversity hub, obtained from the NOAA Public Domain Library.
I am a Ph.D. Candidate at the University of Connecticut–Avery Point studying the marine carbonate system in the Arctic Ocean. My research focuses on biogeochemical changes occurring within sea ice as the Arctic continues to warm. Outside of my research, I enjoy hiking, running, aerial gymnastics, paddleboarding, traveling, and spending time with family and friends.