Reviewing: Kuwae, M. et al. Sedimentary DNA tracks decadal-centennial changes in fish species abundance. Commun. Biol. (2020). doi:10.1038/s42003-020-01282-9
A tale of too few tails
How many fish live in the ocean? That’s difficult to answer because estimating fish abundances takes an arm and a leg— or rather, a fin and a tail. Given their high mobility and large habitats, fish are mostly invisible to us making surveying fish populations particularly challenging. To estimate living fish populations, scientists rely on data collected from multiple sources – including fisherman’s catch, oceanographic data, and ecological surveys.
To see how fish populations are counted, check out this video by Fisheries and Oceans Canada.
Of the 18,000 fish species on earth, only a few are evaluated annually. These tend to be species that are profitable, especially ecologically important or threatened. Although we know a fair bit of information about present-day fish populations, we know far less about what these populations looked like in the past. Even for the species that are assessed annually, monitoring records tends to go back only about a century. As a result, the history of fish abundances for the majority of fish species are poorly understood or altogether unknown.
Why would we want to know about historical fish populations? For one thing, we have observed that many fish populations ebb and flow dramatically over time. It could be that these booms and busts are natural fluctuations in the system as fish respond to regular changes in oceanic or climatic cycles — or it could be that these patterns are caused by human pressures like fishing or global warming. By reconstructing historical fish populations and observing their dynamics from a time that predates intense pressure from humans, we may be better able to determine the cause of present-day fluctuations and identify which force most impacts fish species today. And that means, we could do a better job managing and conserving them in the future!
Fishing without fishing
So, how do scientists propose to reconstruct historical fish abundances? What evidence do fish leave behind when they die? The answer: DNA — environmental DNA (eDNA) to be more specific. eDNA techniques involve analyzing the genetic sequences of DNA from bulk environmental samples of rock, water, or soil. Just like we leave DNA all over the place — like dead skins cells that flake off when we scratch an itch or hair when we groom ourselves — animals leave DNA all over their environment too. And, when marine organisms die and sink to the seafloor, their bodies continue to release DNA into the environment as they decay. New sediment or debris settles to the seafloor over 10’s to 100’s of years and buries the DNA which, under the right conditions (cold and poorly oxygenated), can be preserved for centuries!
Scientists propose to use this archive of DNA preserved in seafloor sediments to understand who was alive 100’s of years ago. Recent studies have shown that the abundance of fish eDNA is reflective of the number of living fish supplying the eDNA. But, what remains to be tested, is if well-preserved ancient eDNA also matches the abundance of fish that would have been supplying the DNA centuries ago.
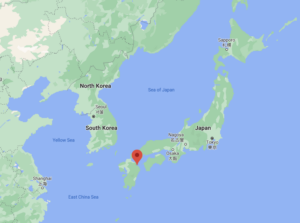
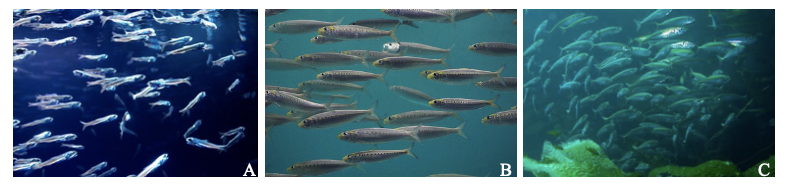
The Japanese research of Dr. Kuwae and others set out to test if ancient sediment eDNA tracks historical fish abundances from Beppu Bay, Japan. This site is ideal for this study because here, sediment conditions benefit DNA preservation and there are good records of fish abundance from the last 50-100 years for three major fish species – the Japanese anchovy, Japanese sardine, and jack mackerel. These data include reports on fish catch and fossilized fish remains (mainly fish scales) in the sediment, which is considered proportional to fish abundances in the waters above.
The team of researchers obtained sediment cores from the Beppu Bay. They cut the cores into slices, with the lowest slices representing the most ancient sediments. DNA was extracted from each slice of sediment, and a method called quantitative real-time polymerase chain reaction (qPCR) was used to identify fish species in the area and estimate their abundance. These values were compared to the known numbers of each fish species from annual fish catch data and fish-scale abundances to see how well DNA abundances matches fish populations over time.
Valuable findings from the deep seafloor
Using ancient eDNA techniques, Kuwae and fellow scientists detected anchovy, sardine, and jack mackerel DNA in sediments dating up to 300 years old! The sediment eDNA concentrations were well-correlated with the fish catch data for all species, and even captured well-known fish population dynamics on shorter timescales (~10-100 years) such as alternating peaks between anchovy and sardine populations.
Ultimately, the method proposed by Dr. Kuwae and colleagues seems a viable technique to reconstruct historical abundances of fish on timescales of tens to hundreds of years. However, the utility and accuracy of this method is likely variable by habitat based on its long-term conditions and stability in supporting DNA preservation, which will require future research. Though still in its early stages, this method shows promise to strongly supplement traditional fish surveying assessments. With luck and hard work, we’ll get better at understanding the fish populations of the past— which may help us do a better job of management and conservation today and into the future.
Did you find this research interesting? Want to learn more? See this post by the authors of the study describing their research.
I am a recent PhD grad in Biological Oceanography at the University of Hawaiʻi at Mānoa. I study the community ecology of abyssal animals across space, time, and habitat, and I ask questions often with regard to human impact, specifically deep-sea mining.