
This June, we entered the 2018 Atlantic hurricane season carrying the burden of fresh wounds; last year’s string of hurricanes added up to one of the most catastrophic seasons on record. Collectively, the 2017 hurricanes cost thousands of lives and over $300 billion U.S. dollars (USD) in the destruction of homes, businesses, and infrastructure. Many survivors’ lives were left in ruins.
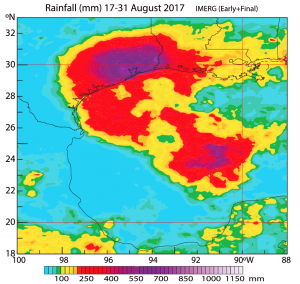
Most of the damage was caused by three major hurricanes that occurred within a month of each other: Harvey, Irma, and Maria. Harvey was unique in that it poured exceptional amounts of rain on the Houston area (see Figure 1), flooding hundreds of thousands of homes, displacing tens of thousands of residents, and causing $125 billion USD in damages. It’s tied with Hurricane Katrina (2005) as the costliest hurricane in U.S. history. After evaluating its effects on the Greater Houston area, the U.S. Geological Survey reported last week that Harvey was the most significant rainfall event on record in the country.
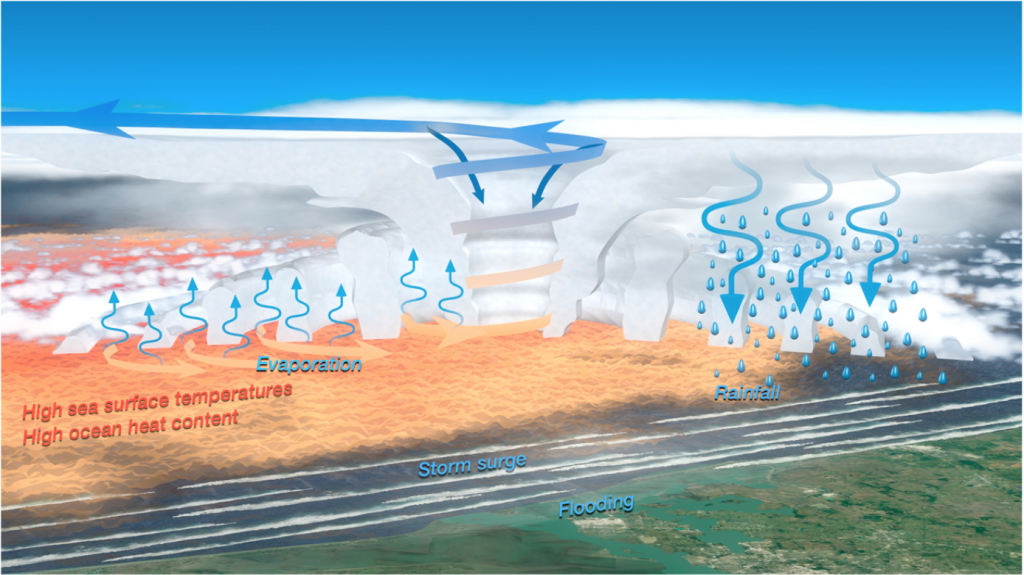
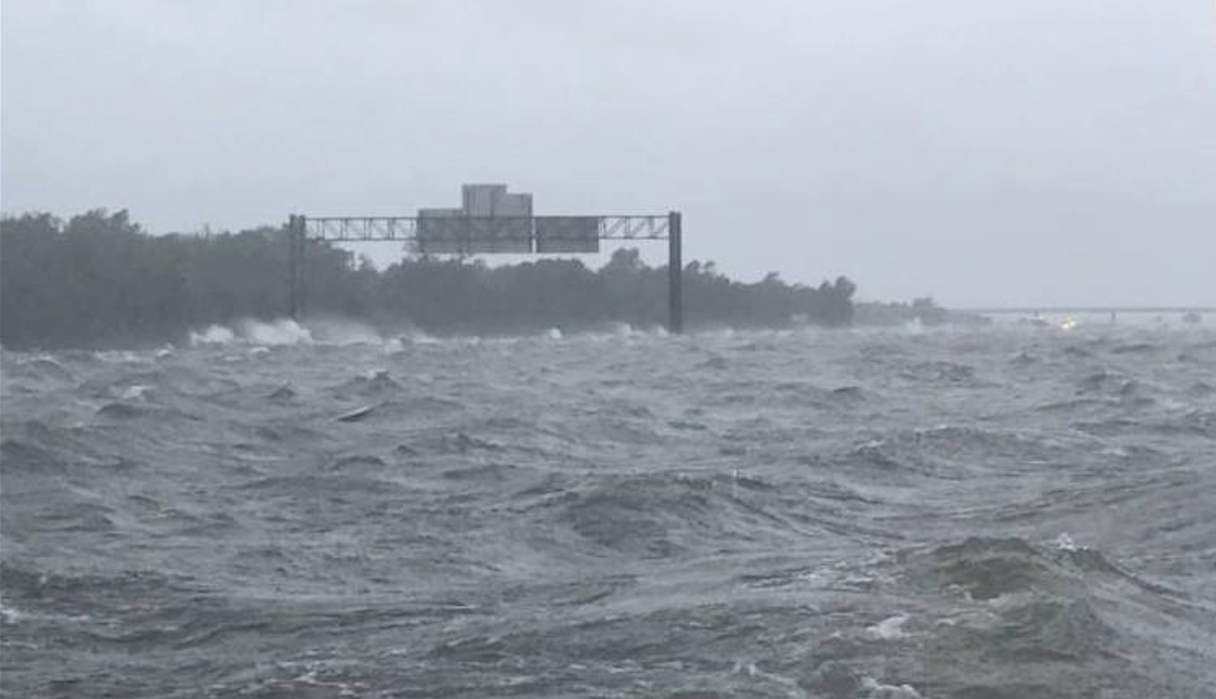
Harvey, a category 4 hurricane with winds reaching over 130 miles per hour, barreled through the Gulf of Mexico before making landfall in Texas on August 26th, where it collided with an atmospheric front – a boundary between air masses of different temperatures. The front acted as a barrier that locked the storm in place over the Houston area. By being situated over both land and water, it was continuously fed by warm, moist air from the sea while pouring torrential rain over land (see Figure 2).
The science of Harvey’s rare, heavy rainfall – which amounted to over 60 inches within a week in some areas – has been explored by the present study. The researchers used a compilation of ocean data from the past 50 years to show that a warmer climate (hence a warmer ocean surface) can directly impact the intensity, duration, and precipitation of recent tropical cyclones.
The Science
For starters, let’s outline the conditions scientists have found necessary – but not sufficient – for a tropical cyclone to develop:
- Warm sea surface temperatures (SSTs) – at least 26.5°C (80°F)
- Sufficient humidity (moisture) in the mid-atmosphere
- Instability (convection) – warm, moist air that rises due to its buoyancy, or lightness
- A preexisting disturbance – such as an atmospheric wave that initiates spinning in the air
- At least 5° latitude from the equator – allowing amplification of the spinning from Earth’s rotation
- Low wind shear – a small change in wind speed with height that preserves the storm’s vertical structure
While all of these conditions must occur simultaneously, their presence does not guarantee formation; however, appropriate conditions can prompt intense and long-lived storms once they do form. This is why the frequency of tropical cyclones is not projected to rise with a warming planet, but the intensity and duration most likely will (IPCC, 2013).
The study focuses on the first three conditions – a warming ocean surface, high humidity, and convection. The process at the root of these conditions is called latent heating – or evaporation – in which the warm ocean surface cools itself by absorbing heat into water vapor that rises into the atmosphere. The heat is released when the vapor condenses into clouds and rain, warming the air and fueling storm clouds.
The ocean’s record heat fueled Harvey’s long, intense life
The researchers used Harvey as a case study to explore how the unusually high upper ocean heat content (OHC) – the amount of heat stored in the upper ocean – was abruptly reduced after the storm swept through the Gulf of Mexico last August. They compared data over 20-day intervals before and after the storm. Observations from floats, moorings, ships, and satellites were combined to find the OHC in the Gulf using temperatures from the upper 160 meters (525 feet) of the ocean, within the surface layer that holds most of its heat.
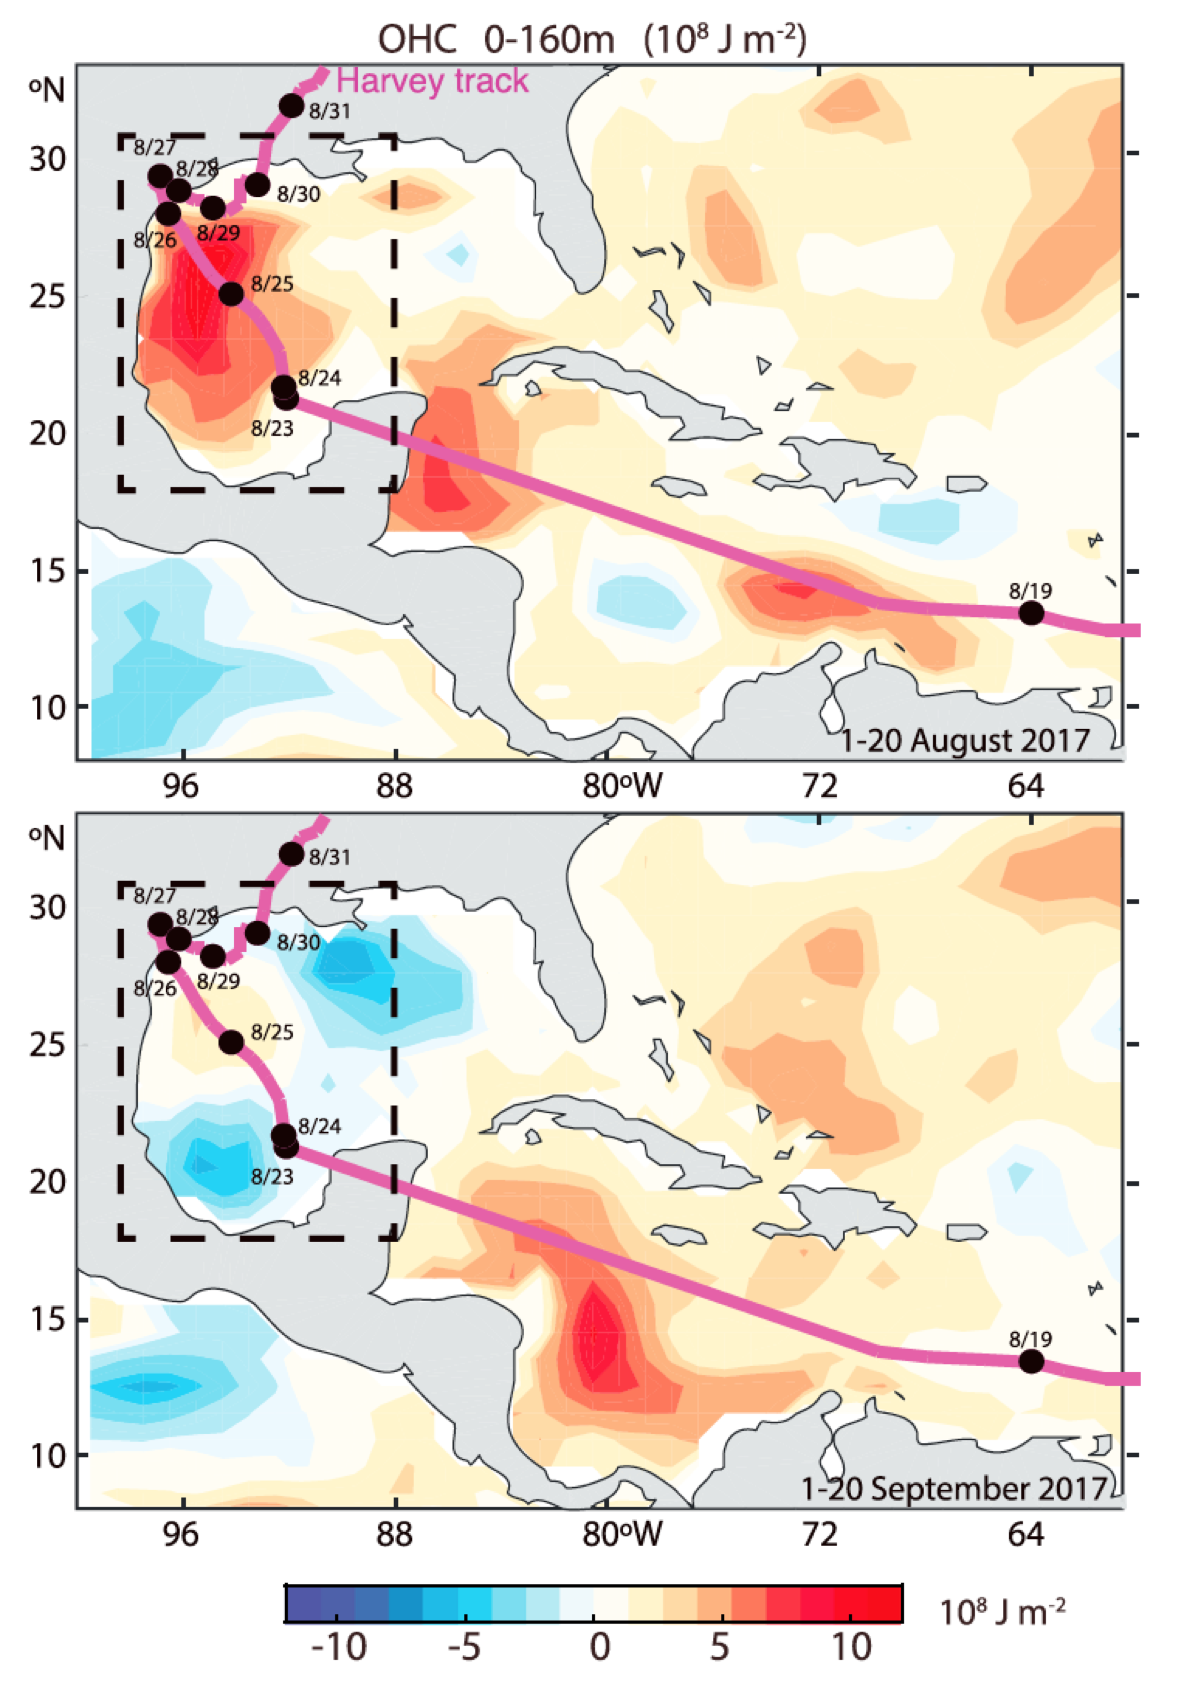
By comparing 2017 to average conditions from 1961-1990, they found that the surface layer in the Gulf of Mexico contained record amounts of heat prior to Harvey (see Figure 3) with associated SSTs above 30°C (86°F). After Harvey, temperatures in the surface layer had reduced by 1-2°C (2-4°F) while deeper temperatures remained the same, indicating a heat loss to the atmosphere. It seemed probable that the sudden heat loss was caused primarily by latent heating (or evaporation) from Harvey. Thus, the record rainfall was likely the result of an unusually large quantity of heat and moisture extracted from the ocean.
The reduction in surface temperature, while immense, still left behind SSTs above the threshold for a hurricane to thrive. This is not very common, and likely contributed to Harvey’s long duration. Usually, hurricanes leave behind a “cold wake” – a track of cold surface water that has been pumped up from the deep by the storm’s rotation, helping it weaken. In a warmer climate, the surface OHC is so immense that even a powerful hurricane like Harvey could not disrupt the full depth of the warm surface layer.
After accounting for other factors and uncertainties, they were able to demonstrate that the reduction in OHC was likely the direct effect of latent heating by Harvey – evaporation enabled by record heat content in the surface layer – which prolonged torrential downpours.
The Impacts
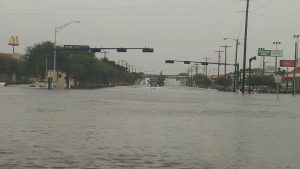
Flooding from Harvey completely devastated residents of the Houston area. The wettest hurricane in U.S. history caused massive roadway closures and vast power outages, requiring tens of thousands of stranded residents to be rescued by helicopter or personal boats. Over 100 people could not be saved, and died during or after the storm. Many displaced residents had no home to return to.
A friend of mine, Sofia Ghouse, moved to Houston four years ago to begin work at NASA as an engineer and flight controller. While she felt quite lucky to have been spared damage to her own home, she recalls her paranoia during the downpours that lasted for several days. Would the water reach her doorstep? Was it safe to fall asleep? Hurricane warnings had been vague, so she checked the weather on her phone obsessively. Having come from the Midwest, she struggled with the concept of having no safe space to escape to, having to simply wait it out.
In the final days of the storm, she recalled that Dickinson, a city on the outskirts of Houston, was hit very hard. Many of her colleagues who lived in the area had to be evacuated. There was an uneasy charge in the atmosphere at work for a while.
“Everyone’s still shellshocked from Harvey,” said Jen Culham-Hamilton, a resident who has lived near Galveston for the past 15 years, describing the trauma left in Harvey’s wake. Jen was heavily involved in volunteer relief efforts immediately after the storm and for the following months, especially in the Dickinson area.
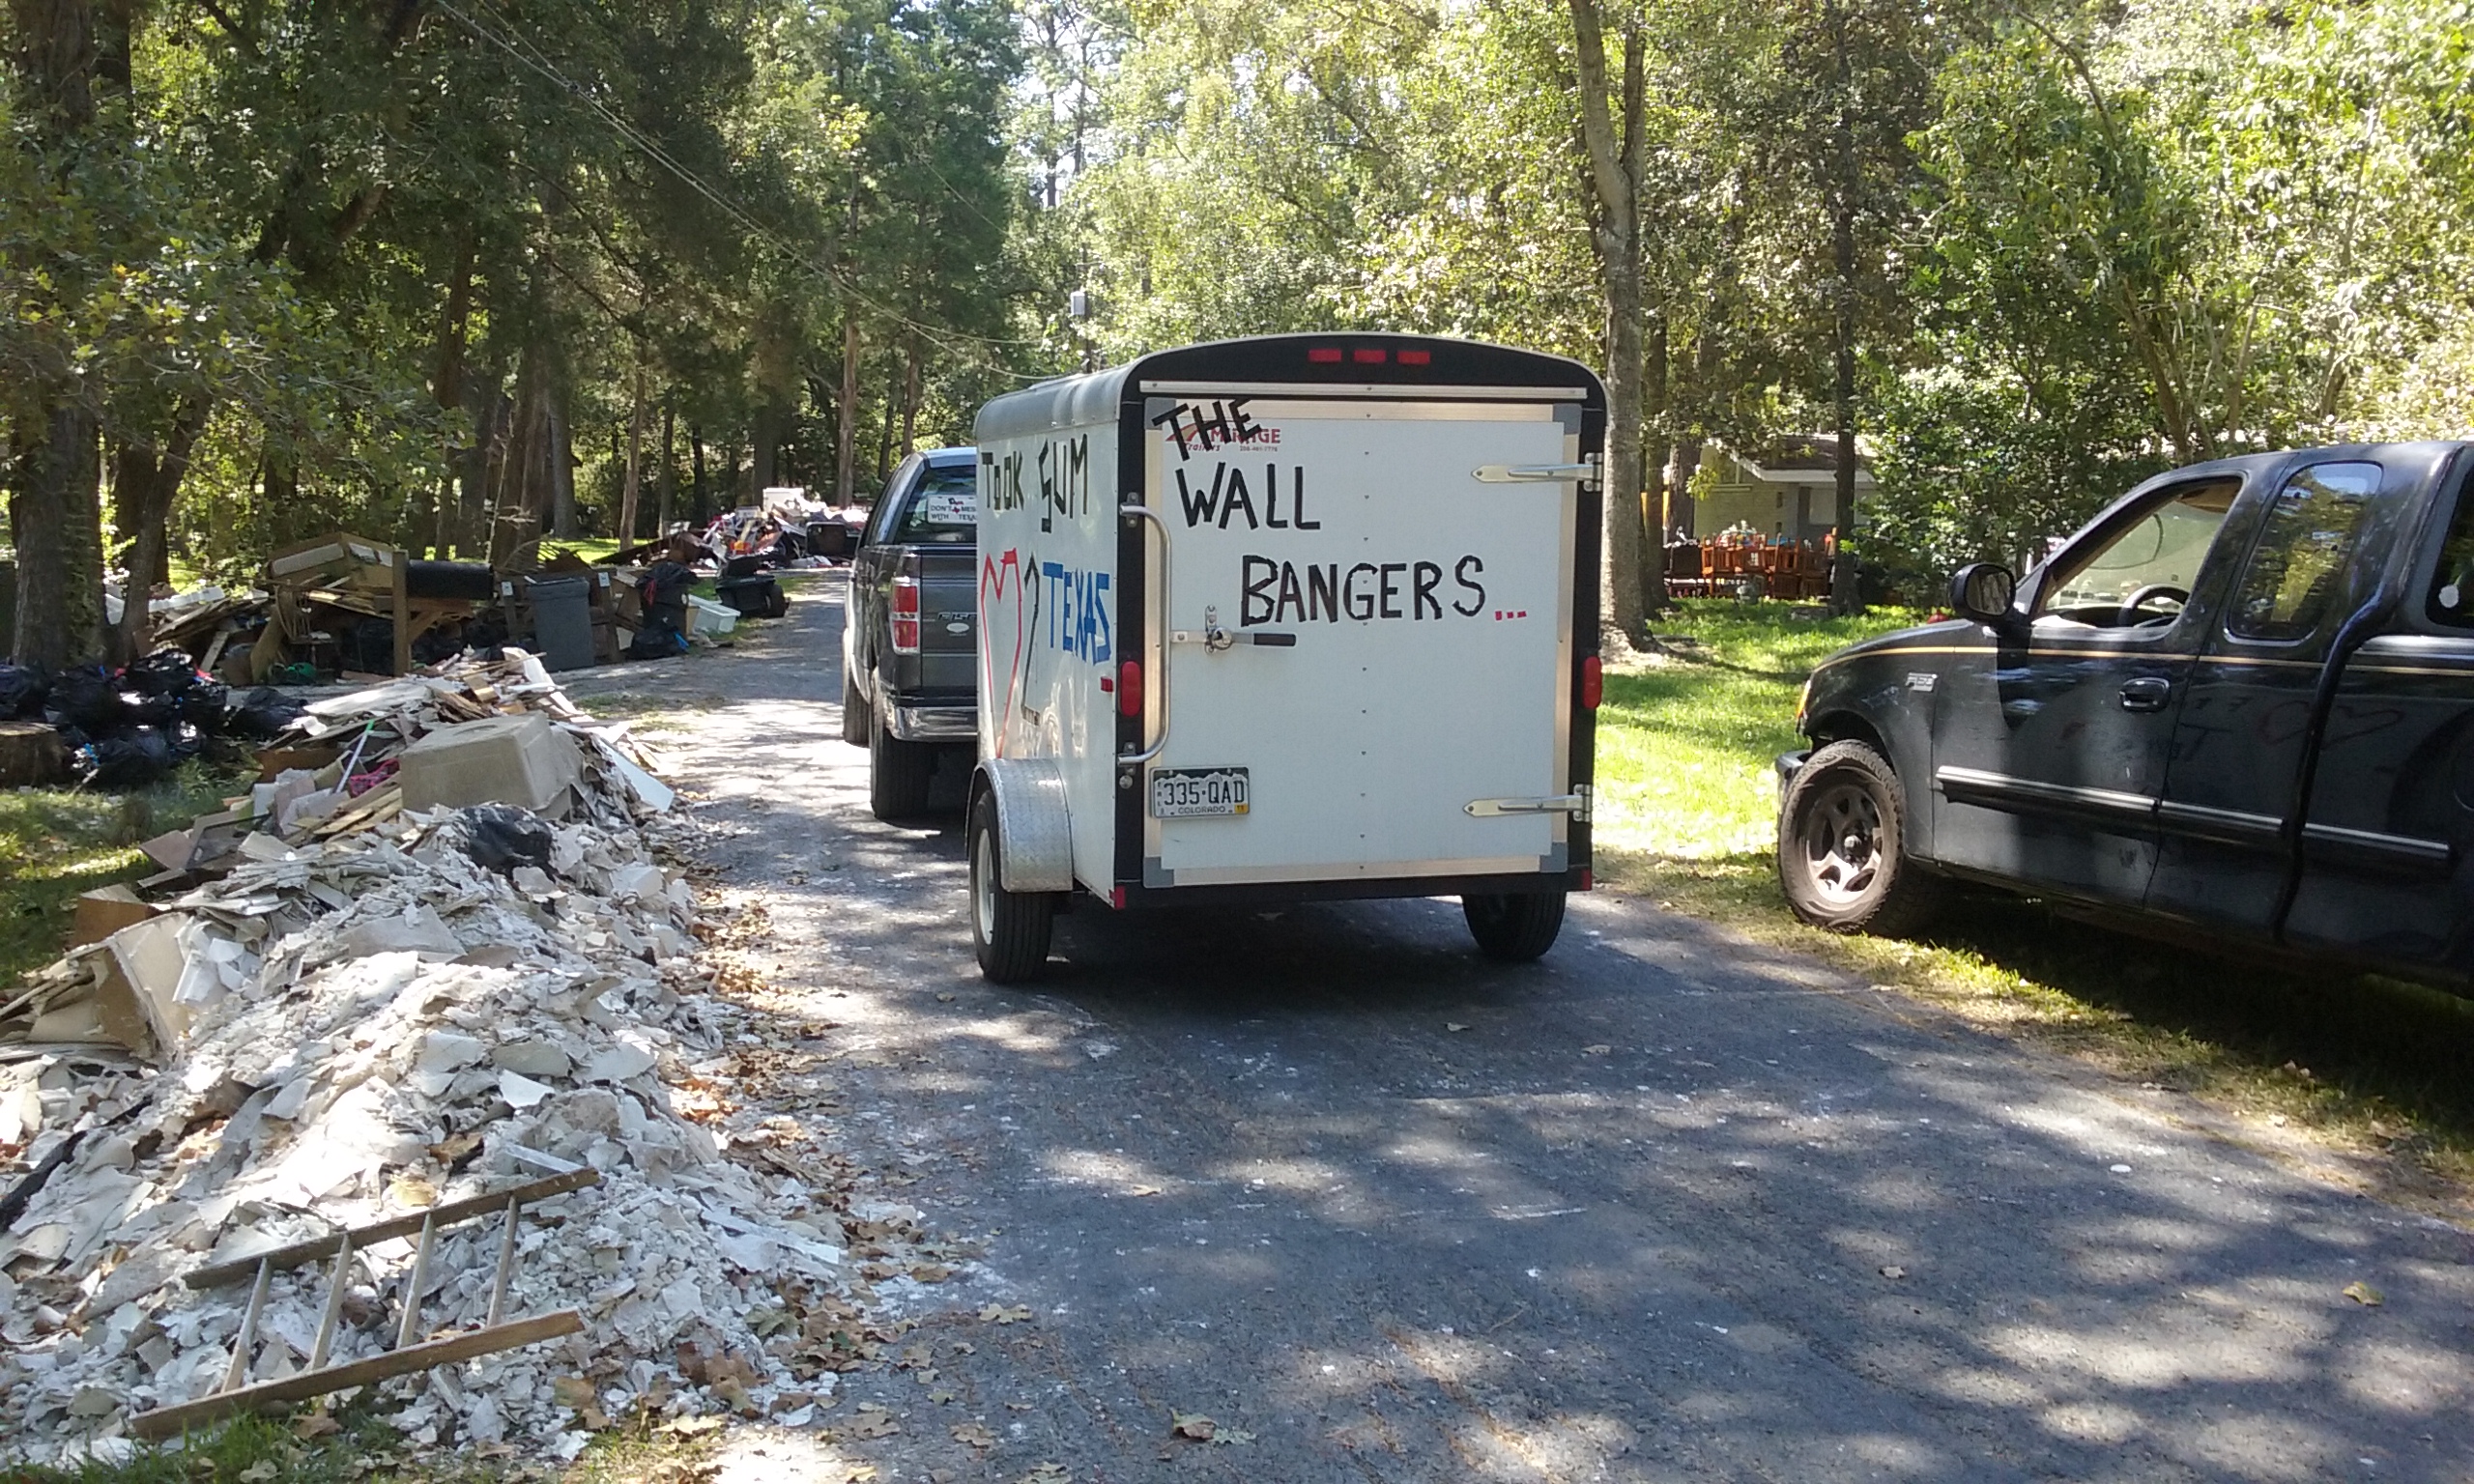
At least two dozen of her friends and family were severely impacted by the floods, which is how she initially became involved with a group of volunteers who gutted 5-7 houses a day for six weeks straight. They came to call themselves the “Harvey Wall Bangers,” a term her friend coined when she witnessed their tireless efforts to quickly work through severely damaged homes that grew layers of mold within a couple days in the extreme heat.
“At first, everyone walked around in a daze,” she told me, describing the immediate aftermath of Harvey. “It wasn’t just their house – it was everything they owned that got ruined.” Documents, family photos, mementos, electronic devices – many people lost everything.
While Jen suffered from exhaustion and a lung infection after being exposed to moldy air during relief efforts, she noted that the lasting effect has been the emotional trauma of the experience. A bit of rain triggers anxiety. Concern over what will happen to the dispossessed overwhelms her. The despair still haunts her and many volunteers and victims she knows, while the rest of the country appears to have moved on.
How can we adapt?
The flooding caused by Harvey was exacerbated by urban sprawl in the Houston area. Houston’s economy has flourished in recent decades, with a population expanding from 400,000 to a whopping 6 million residents (Kimmelman, 2017). This boom has led to unconstrained development onto floodplains, coastal prairies, and wetlands that once helped absorb floodwater.
Using the scientific findings of the present study, the researchers place Harvey in the context of adaptive measures to avoid disasters caused by increasingly severe weather. Harvey was an unfortunate example of what can go wrong when communities are not prepared or even made aware of risks. For example, most properties in the area were not covered by the National Flood Insurance Program (NFIP) – federal insurance intended to protect those vulnerable to flooding. Why were only 1 in 6 households in Harris County (a hard-hit area) covered by the NFIP? Jen and Sofia, who both participated in relief efforts in Dickinson, noted that very few if any of the lower-income homes – the most vulnerable – were covered by any sort of insurance at all.
The researchers emphasize that work needs to be done to overcome the challenges of a changing climate in coastal regions. Some of this work includes addressing inadequate regulations on building design and maintenance, property development restrictions (zoning), and amendments to insurance policies that consider the realities of growing flood risks due to climate change.
It won’t be easy to catch up to the already present impacts of a warming planet. Regardless, I was left with earnest hope learning about the community response to Harvey’s destruction. Those who so naturally took time off from work, traveled from afar, donated money, used personal boats, risked their emotional and physical health – all to rescue, support, and befriend strangers in need – are deeply inspiring. Perhaps policymakers could learn a thing or two from their humanity.
Additional References
IPCC (2013). Climate change 2013: The physical science basis. In T.F. Stocker, et al. (Eds.), Intergovernmental Panel on Climate Change (1535 pp.). Cambridge, United Kingdom: Cambridge University Press.
Kimmelman, M. (2017). Lessons From Hurricane Harvey: Houston’s Struggle Is America’s Tale. New York Times. Nov 11, 2017. https://www.nytimes.com/interactive/2017/11/11/climate/houston-flooding-climate.html.
Thank you to Sofia Ghouse and Jen Culham-Hamilton for speaking to me about your experiences. Thank you to Afonso Goncalves for introducing me to this paper.
I’m a PhD student at the University of Rhode Island’s Graduate School of Oceanography. I use a small-scale computer model to study how physical features like surface waves at the air-sea interface produce friction for the wind that can limit momentum, energy, gas, and heat exchange between the ocean and atmosphere. In the future, I hope to learn more about the role waves play in different parts of the world as weather and climate patterns evolve. Also, I love to write.
