In autumn 2015, a large collaborative field expedition took place in the western Arctic as part of a program to understand a particularly interesting feature of this region – marginal ice zones (MIZs). Occurring at both poles, they are described as falling somewhere between full ice and open ocean; a diverse array of ice floes (cracked glass-like sheets), frazil ice (slush), nilas (thin saran-wrap-like surface sheets), and others, all of which help to describe the ocean-atmosphere dynamics that assist in diminishing and recovering the seasonal polar ice cap each year (see Figure 1).
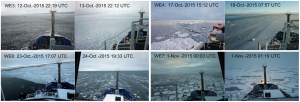

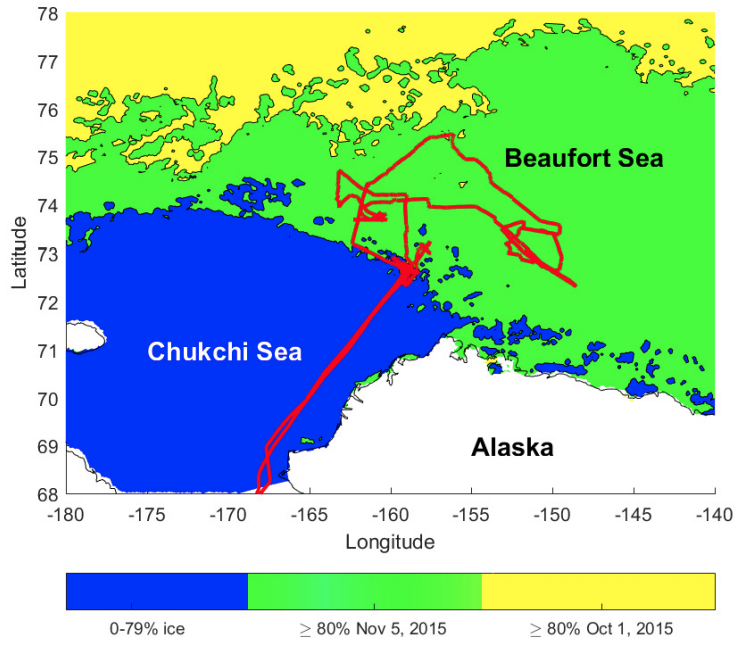
Scientists set out on the R/V Sikuliaq (see Figure 2) from September 28 to November 10 to gather measurements near the ocean surface while airplanes and satellites took data from above – a unique campaign aimed at learning more about the understudied harsher months of the year when field work in the Arctic is difficult. During the six-week expedition, the sea ice expanded 250 nautical miles from the Beaufort and Chukchi Seas south to the Alaskan coast (see Figure 3). The goal: to capture as much information as they could about wind, waves, and ice during the autumn refreezing period.
Researchers participating in the Sea State and Boundary Layer Physics of the Emerging Arctic Ocean program have been analyzing this data for the past 2.5 years to understand how diminishing sea ice in the Arctic is affecting the dynamics at depths directly above and below the ocean surface – that is, within the boundary layers of the upper ocean and lower atmosphere. These boundary layers are slabs of air or water neighboring and interacting with the air-sea interface, serving as dynamic pathways of heat, gas, and momentum exchange between the ocean and atmosphere that drive weather and climate.
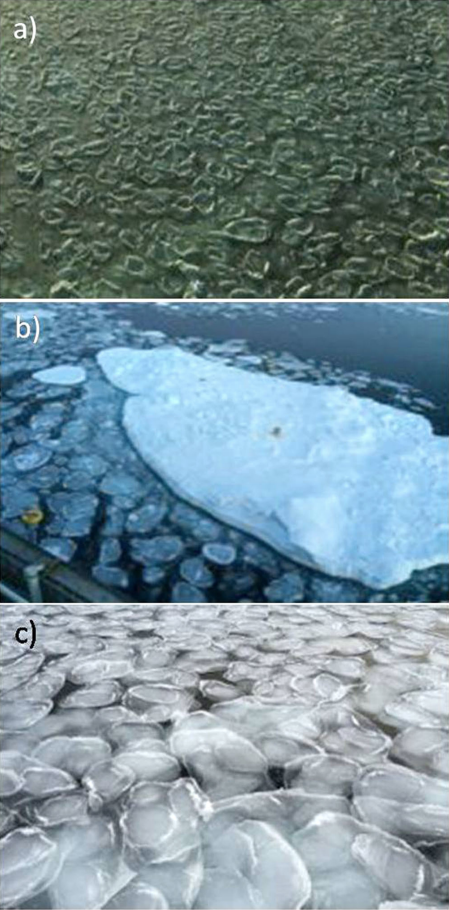
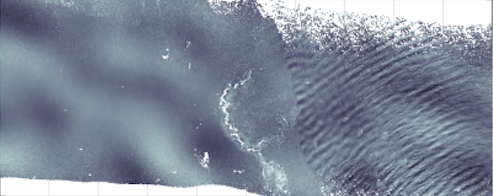
Boundary layers in the MIZs are affected by diverse and transient ice patterns directly coupled to air-sea processes such as wind-waves and heat exchange, making them extremely complex. Their fleeting nature can be due to weather systems that pass through the region, drastically altering the ice within a few hours to days. Strong Arctic winds blow over exposed ocean surface, producing waves that can grow larger when they have more open ocean surface on which to move. They can even move through the slushy, fragmented ice in MIZs; as they propagate, they lose momentum to the ice, breaking and moving it around. This can form remarkable patterns that signal enhanced wave activity within the ice; an example is in the formation of pancake ice (see Figure 4) – direct evidence of wave-ice interactions. The ice obtains its pancake shape from movement at the water surface as the waves propagate, compressing slushy frazil ice into packs which collide with each other to form circular shapes with soft, lifted rims. The frequent occurrence of pancake ice in the MIZ during this campaign was a new discovery that showed the increasing importance of wave-ice interactions in the Arctic as it continues to warm.
Conditions in MIZs need to be represented in weather, wave, and climate models to more accurately forecast the effects of climate change. Because pancake ice reflects wave activity, its variability can imply changes to the wave height and “sea state” – that is, how long waves have been propagating and if the wind is currently causing them to grow. For example, smaller (higher frequency) waves propagating through pancake ice are damped while larger waves remain intact. This can be seen in images from airborne lidar, a sensor that uses a laser pulse to illuminate the water waves on the ocean surface, reflecting back to provide information on their size and movement (see Figure 5). This information is critical to understanding how the boundary layers exchange heat, momentum, and gases between the ocean and atmosphere. Unfortunately, widespread ice features like pancake ice are individually too small to be detected by satellite; thus, expeditions such as these are critical to quantifying the large-scale impacts of small-scale ice dynamics.

Studies during the Arctic summer have pointed to enhanced thinning and retreat of sea ice that had once been stable throughout the year. This means that the seasonal minimum volume of sea ice in the Arctic, usually occurring in September, keeps getting smaller. What mechanisms are causing this? Results from this campaign suggest that variability in ice formation, which occurs during autumn in MIZs, leaves an imprint on the ice that affects how it melts the following spring. In other words, the Arctic is no longer able to bounce back each year.
The coupled nature of the wind, waves, and ice complicates our understanding of their interactions. Each affects the other simultaneously, so it’s not easy to track which feature is controlling which process. Variable ice conditions drive local wind caused by temperature gradients between ice and the warmer ocean, creating a high-to-low pressure force. Wind can drive waves that break up ice, but they can also move cold air over water to form more ice. The MIZ in autumn is characterized by a seesaw of ice-forming and ice-destroying processes driven by short-term weather events that are often difficult to capture. Thus, this brief overview of the Sea State and Boundary Layer Physics of the Emerging Arctic Ocean program ends by suggesting that more field campaigns like this one continue during this time of year to capture the short-term autumn weather events that can have long-term impacts on the Arctic climate.
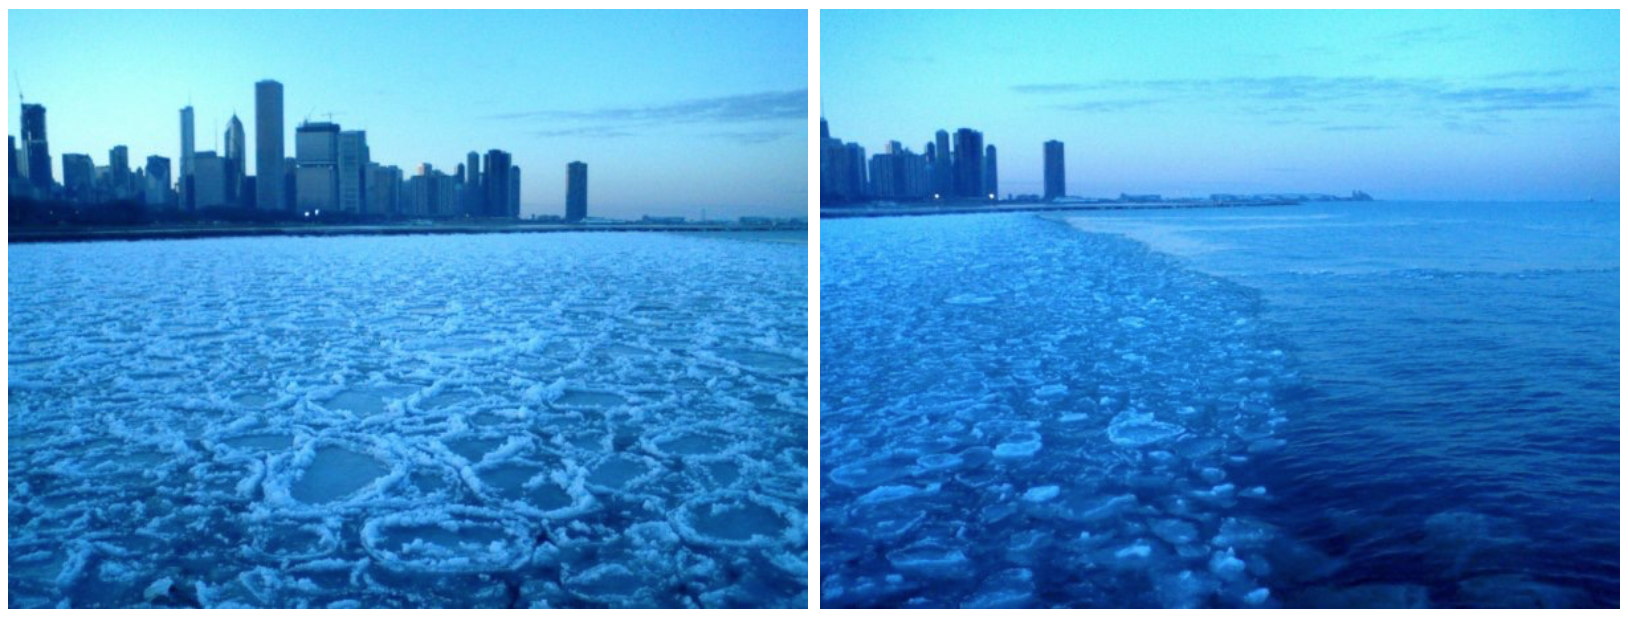
I’ll conclude by saying that pancake ice is a phenomenon that doesn’t just occur in the Arctic. It is known to occur in Antarctica as well, and even in non-polar regions that obtain surface ice, like lakes. Almost 10 years ago (way before I started studying oceanography), I noticed beautiful patterns on Lake Michigan in Chicago, where I lived before moving to Rhode Island. I took these photos on a cold day downtown without knowing what they were or how they formed.
Note:
This overview was the introduction to a special issue of the Journal of Geophysical Research: Oceans focusing on the autumn 2015 field campaign. The researchers participating in the program have been busy analyzing the data, and many have published fascinating papers in the past few months detailing what they found. The images included in this post are referenced from a few of these newly published papers. Check them out below.
Additional References:
Cheng, S., Erick Rogers, W., Thomson, J., Smith, M., Doble, M. J., Wadhams, P., & Shen, H. H. (2017). Calibrating a viscoelastic sea ice model for wave propagation in the Arctic fall marginal ice zone. Journal of Geophysical Research: Oceans, 122, 8770–8793. https://doi.org/10.1002/2017JC013275
Guest, P., Persson, P.O.G., Wang, S., Jordan, M., Jin, Y., Blomquist, B., & Fairall, C. (2018). Low-Level Baroclinic Jets over the New Arctic Ocean. Journal of Geophysical Research: Oceans. https://doi.org/10.1002/2018JC013778
Persson, P.O.G., Blomquist, B., Guest, P., Stammerjohn, S., Fairall, C., Rainville, L., Lund, B., Ackley, S., & Thomson, T. (2018). Shipboard observations of the meteorology and near-surface environment during autumn freeze-up in the Beaufort/Chukchi Seas. Journal of Geophysical Research: Oceans. https://doi.org/10.1029/2018JC013786
Sutherland, P., Brozena, J., Rogers, E.W., Doble, M., Wadhams, P. (2018). Airborne remote sensing of wave propagation in the marginal ice zone. Journal of Geophysical Research: Oceans. https://doi.org/10.1029/2018JC013785
Wadhams, P., Aulicino, G., Parmiggiani, F., Persson, P. O. G., & Holt, B. (2018). Pancake ice thickness mapping in the Beaufort Sea from wave dispersionobserved in SAR imagery. Journal of Geophysical Research: Oceans, 123,2213–2237. https://doi.org/10.1002/2017JC013003
I’m a PhD student at the University of Rhode Island’s Graduate School of Oceanography. I use a small-scale computer model to study how physical features like surface waves at the air-sea interface produce friction for the wind that can limit momentum, energy, gas, and heat exchange between the ocean and atmosphere. In the future, I hope to learn more about the role waves play in different parts of the world as weather and climate patterns evolve. Also, I love to write.